GOLD PRINTS A NINE-YEAR HIGH
The price of gold continues to rally and today touched its highest level in nine-years. The precious metal is nearly 10% higher than the swing-low made on June 5 while gold is around $370/oz. higher than the sell-off low made on March 16 this year. The fundamental backdrop for gold remains positive. The COVID-19 virus continues to spread in the US, fueling thoughts of fresh lockdowns in some Southern states, while the US dollar continues to weaken as a second US coronavirus stimulus package edges nearer. A weak US dollar and lower US Treasury yields are drivers of positive sentiment for gold and silver.
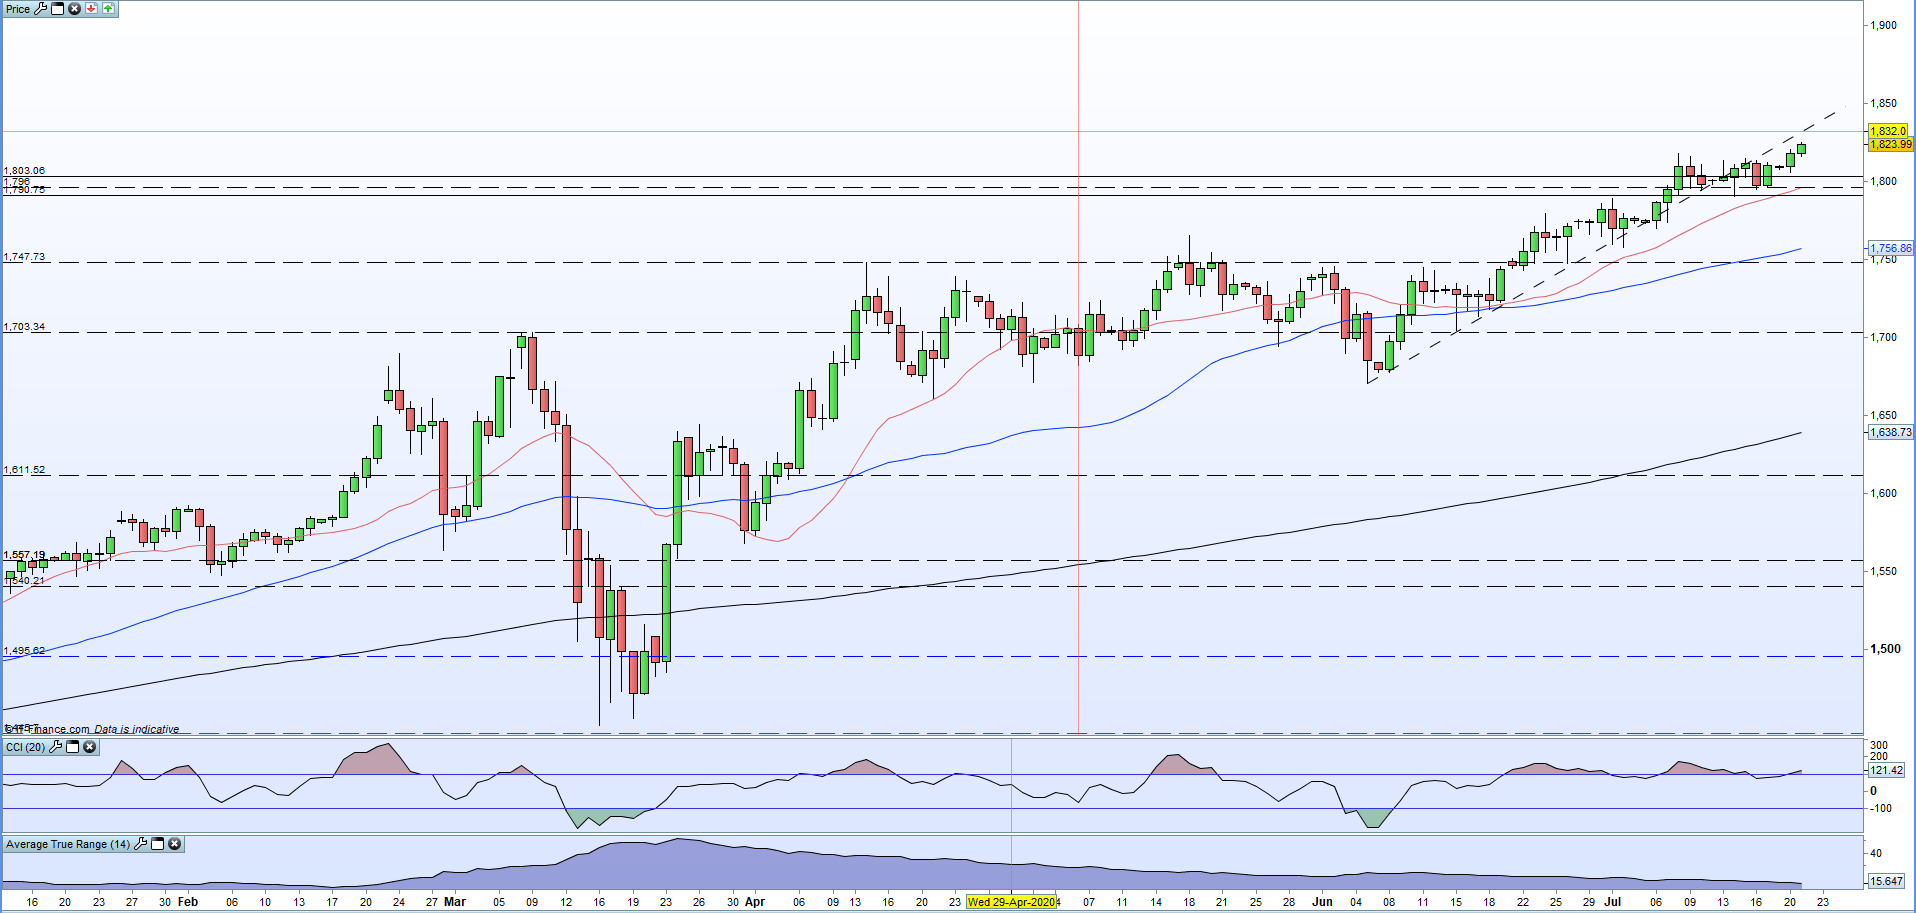
The daily gold chart remains biased towards further upside in the current environment with the precious metal above all three moving averages. The widening of the gap between the 20- and 50-dmas highlights the bullish sentiment currently gripping the market but also warns that the market may be starting to run ahead of itself in the short-term. While the CCI indicator shows gold as overbought, it is not yet back to the extreme levels seen in late-February and mid-May this year. Higher prices look the likely path of least resistance but a period of consolidation may occur ahead of the next move.
GOLD DAILY PRICE CHART (JANUARY – JULY 21, 2020)
SILVER BACK ABOVE $20/OZ.
Silver’s acceleration higher continues this week with XAU/USD back above $20/oz. for the first time in four years. Silver has rallied over 80% off its March 16 low and continues to close the gold/silver spread. Silver underperformed gold sharply from the end of 2019 and has now pulled back most of the losses seen this year.
GOLD/SILVER RATIO

Again the chart looks positive but vulnerable to a set-back although the $19.00 - $19.50/oz. zone should provide a level of support. The mid-July 2016 swing-high at $21.14/oz. is the likely near-term target followed by the September 2013 swing-high at just over $25.00/oz. for a longer-term outlook.
SILVER DAILY PRICE CHART (JANUARY – JULY 21, 2020)

Reprinted from dailyfx, the copyright all reserved by the original author. #XAU/USD##gold##XAG/USD##Silver#
风险提示:本文所述仅代表作者个人观点,不代表 Followme 的官方立场。Followme 不对内容的准确性、完整性或可靠性作出任何保证,对于基于该内容所采取的任何行为,不承担任何责任,除非另有书面明确说明。

暂无评论,立马抢沙发