
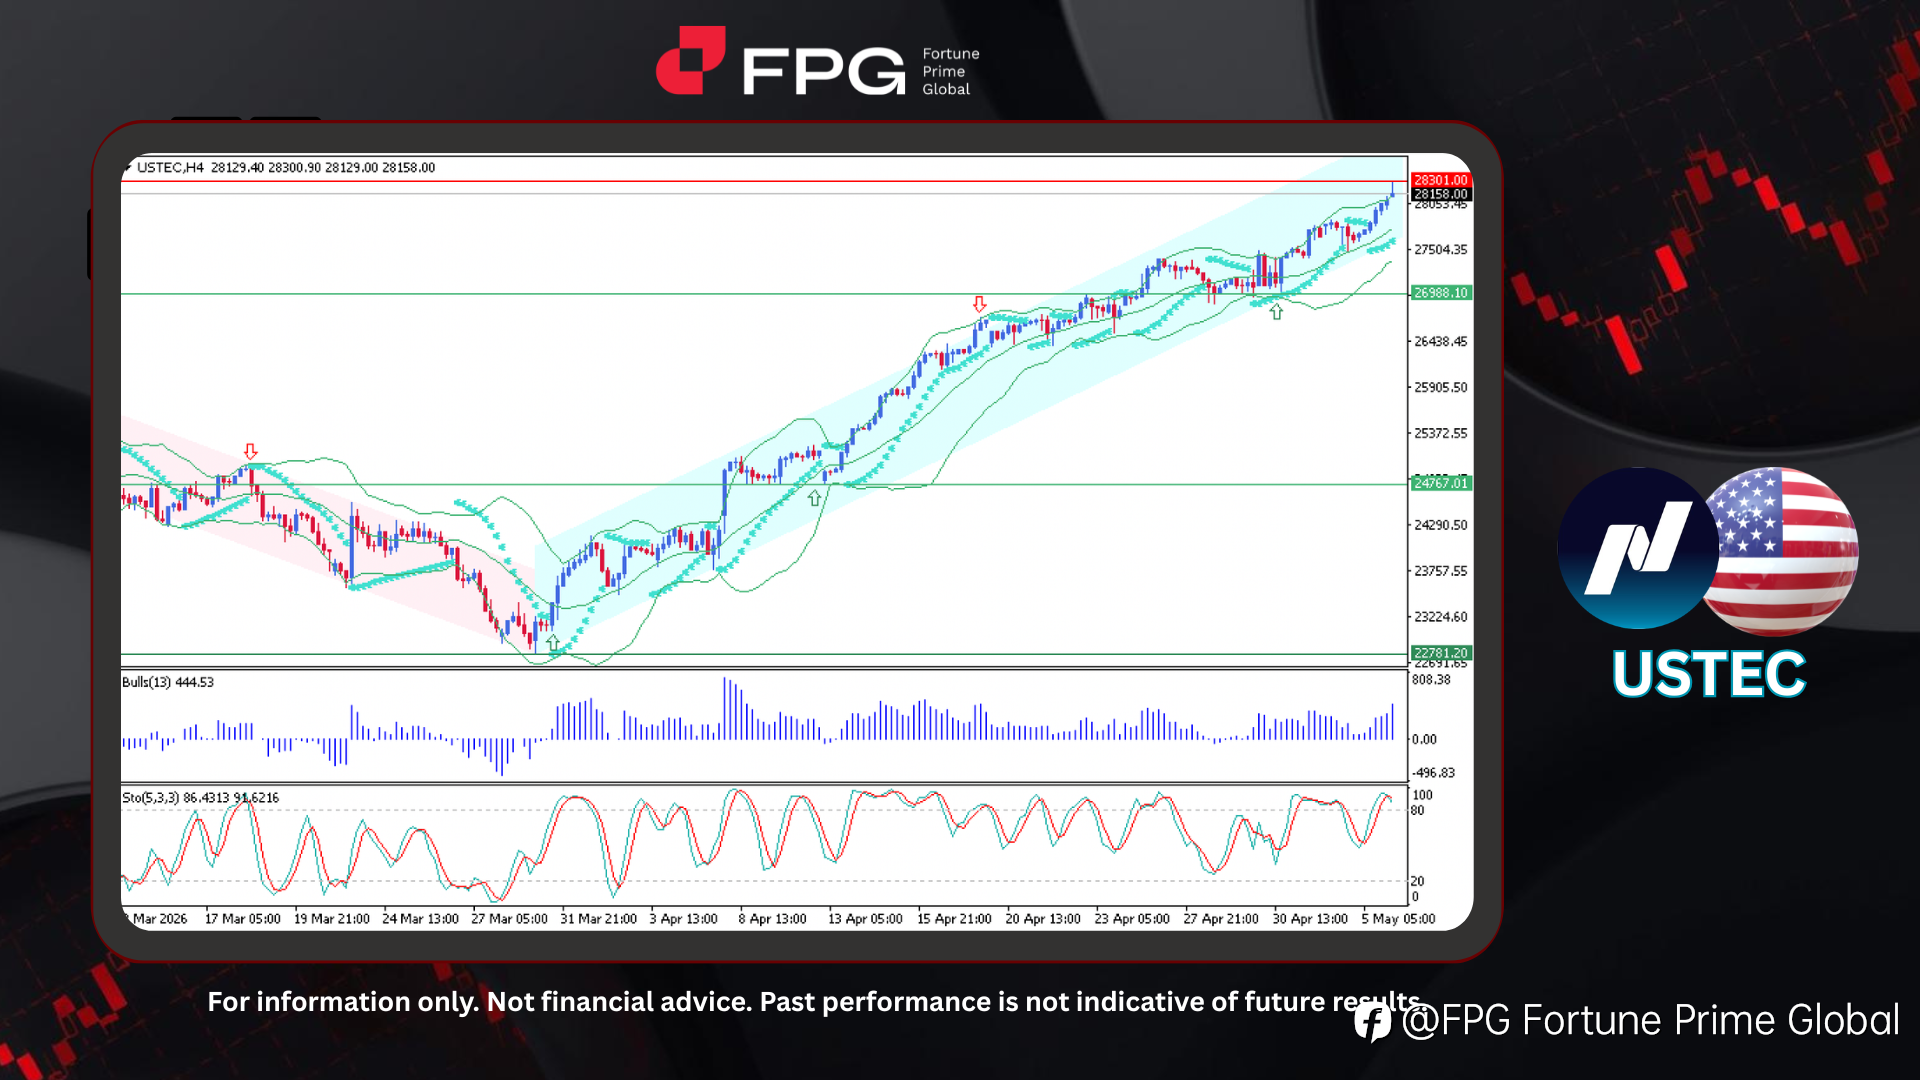
FPG USTEC Market Report May 6, 2026
On the H4 timeframe chart, USTEC (Nasdaq-100) is still moving within an ascending channel, showing a very strong and consistent bullish rally. The chart indicates that the market was previously in a bearish trend, but a clear trend reversal occurred at the end of March, shifting into a bullish phase
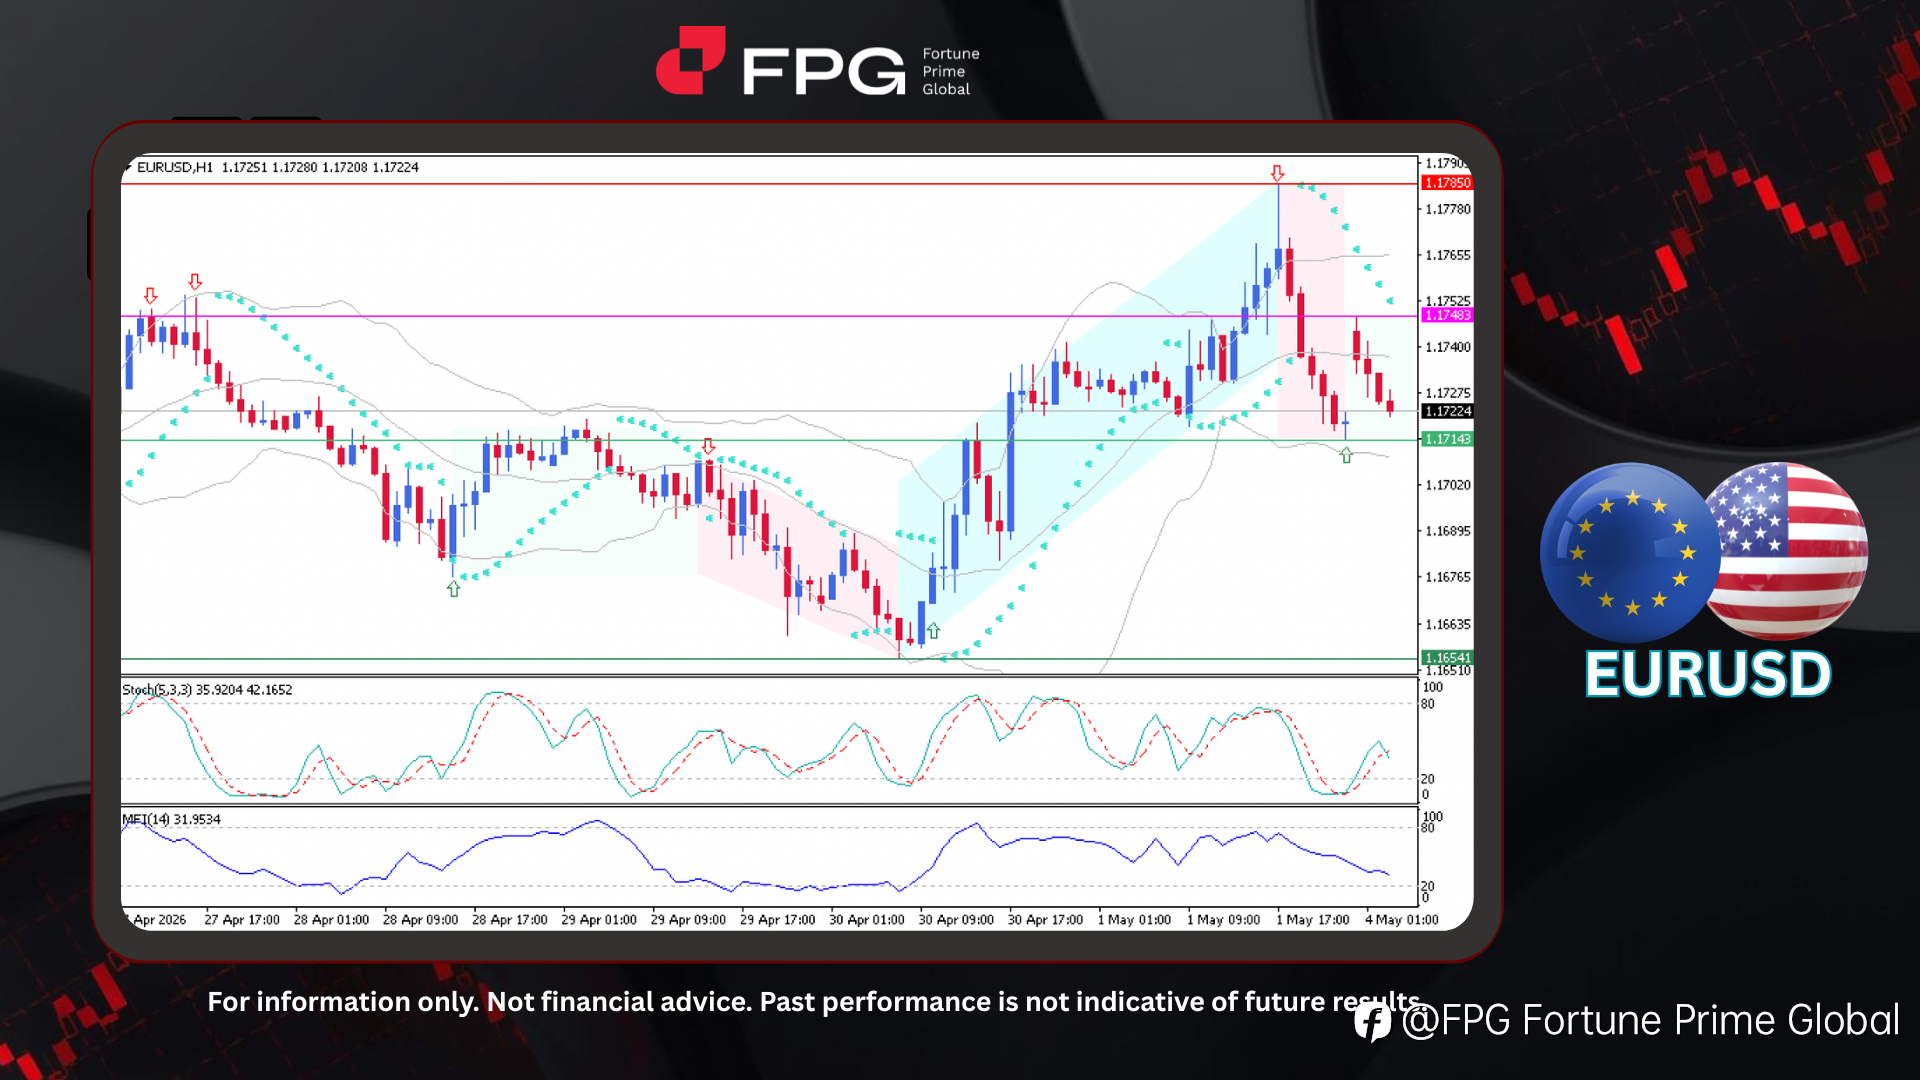
FPG EURUSD Market Report May 4, 2026
On the H1 timeframe chart, EURUSD has recently experienced a price drop from 1.1785 to 1.1714, marking a clear corrective move after the prior bullish impulse. Toward the end of last month, the overall trend was generally bearish, with price forming lower highs and lower lows. However, this structur
What Happened Last Week in the Stock Market?📊
1️⃣ Apple down 15.19% from $222.13 to $188.38 2️⃣ Nvidia down 12.98% from $108.38 to $94.31 3️⃣ Tesla down 7.61% from $259.16 to $239.43 4️⃣ Microsoft down 4.14% from $375.39 to $359.84 Don’t miss out 👉Sign up now to start trading popular stocks: https://www.kvbplus.com/prime/... [

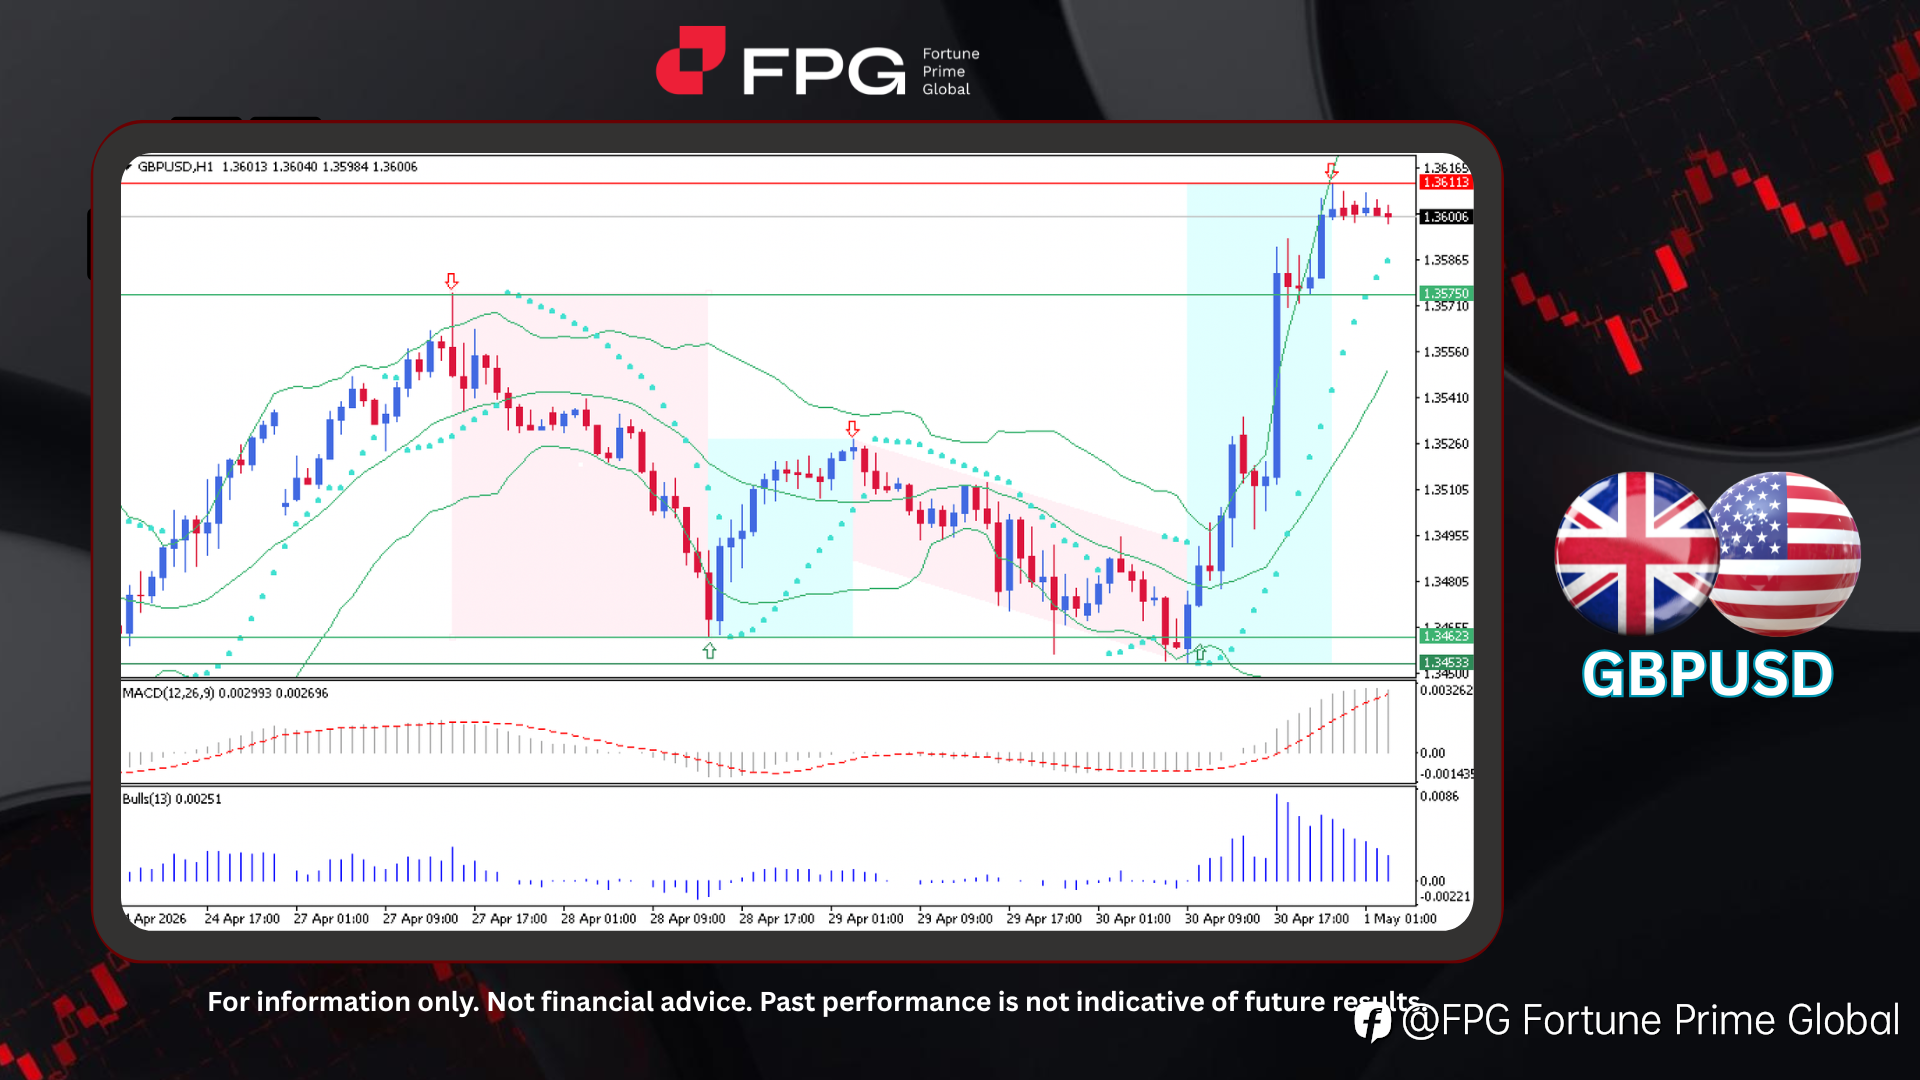
FPG GBPUSD Market Report May 1, 2026
On the H1 timeframe chart, GBPUSD has just experienced a massive bullish surge from 1.3453 to 1.3611, marking the strongest upward movement within the past week. Prior to this rally, price action was characterized by choppy fluctuations and shifting short-term trends. However, the recent impulsive m
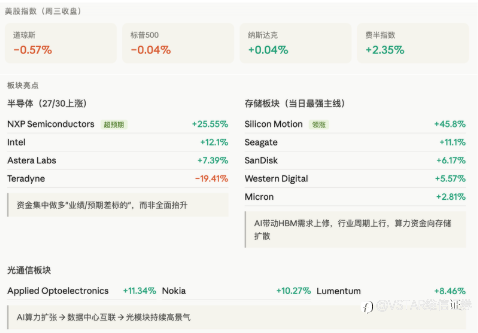
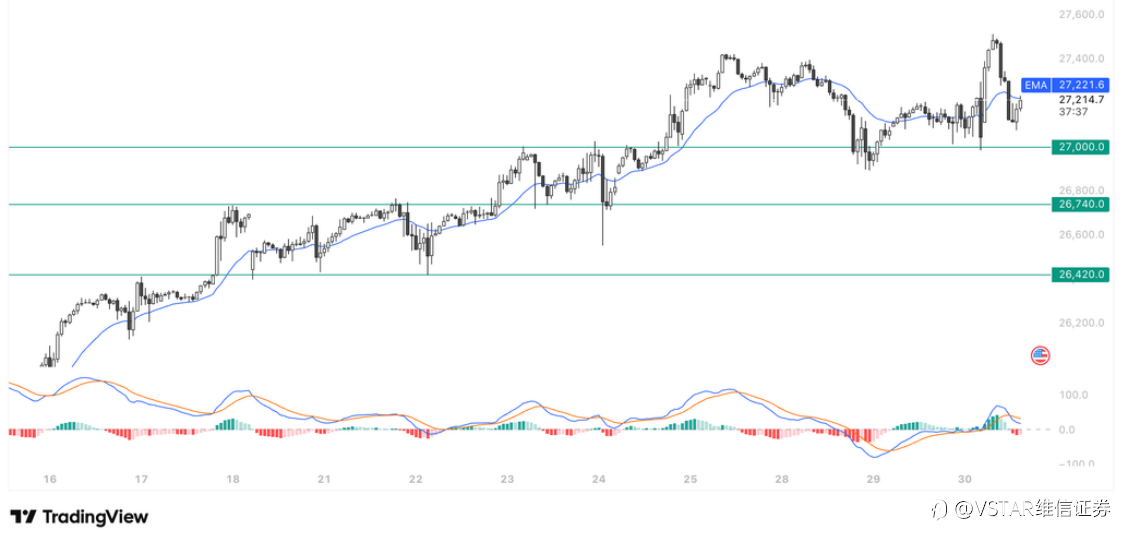
VSTAR每日美股行情(30/04/2026)
大盘回顾 60天战争权限即将耗尽!特朗普称正与伊朗“电话谈判” 昨日美股呈现明显结构分化:道指和标普500分别小跌0.57%和0.04%,道指已连续第五个交易日下跌;但纳斯达克几乎持平(+0.04%),费半指数强势拉升2.35%,成为全场最大亮点。科技龙头普遍承压,NVIDIA跌1.79%、微软跌1.12%领跌,但资金并未离场,而是向半导体细分赛道和存储板块轮动——NXP因业绩超预期单日暴涨25.55%,Silicon Motion更是飙升45.8%。整体来看,AI主线逻辑未破,市场正从龙头抱团切换至"业绩兑现驱动"的精细化选股阶段。 今日盘前分析 今晚20:30美国一季度 GDP+3月PCE
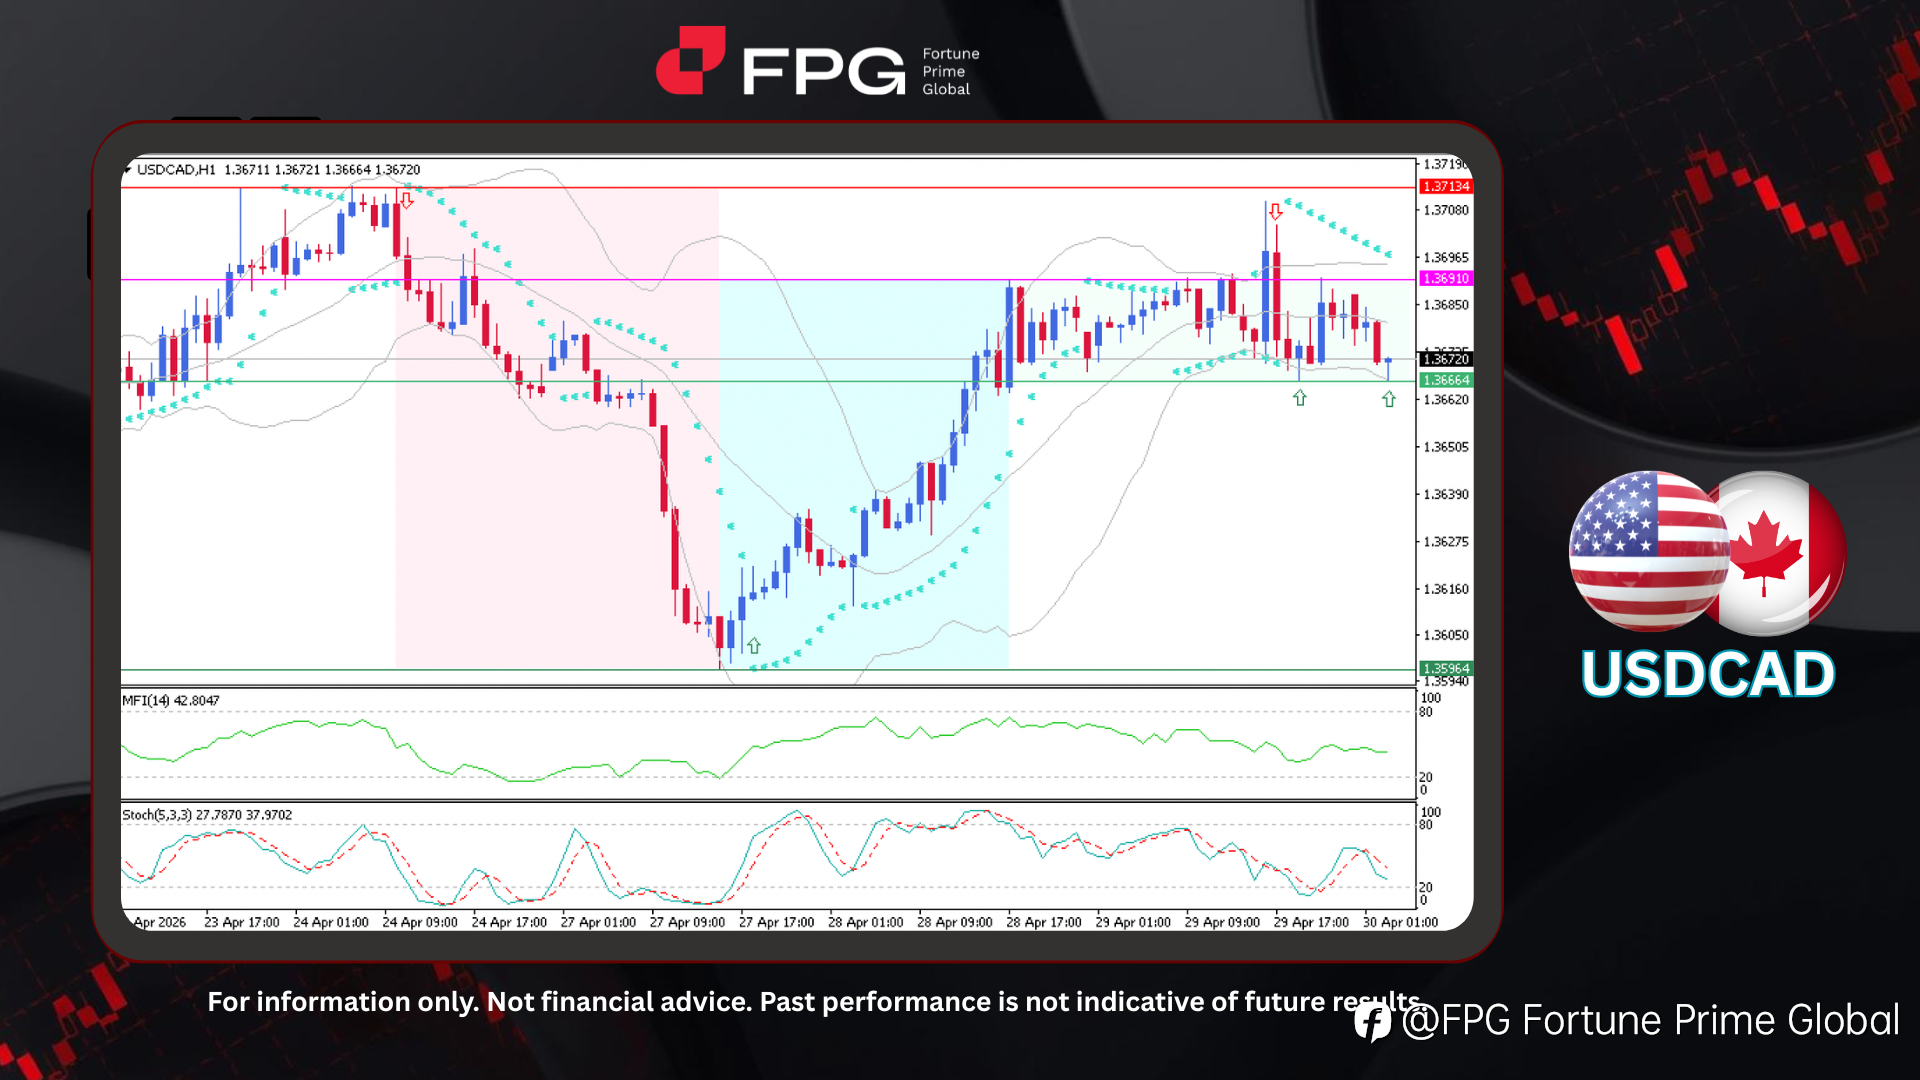
FPG USDCAD Market Report April 30, 2026
On the H1 timeframe chart, USDCAD shows that around last week there was a bearish price drop from 1.3713 to 1.3596, establishing a clear short-term downside structure. From that low point, a trend reversal occurred, leading to a bullish recovery up to 1.3691, indicating a shift in momentum. Followin
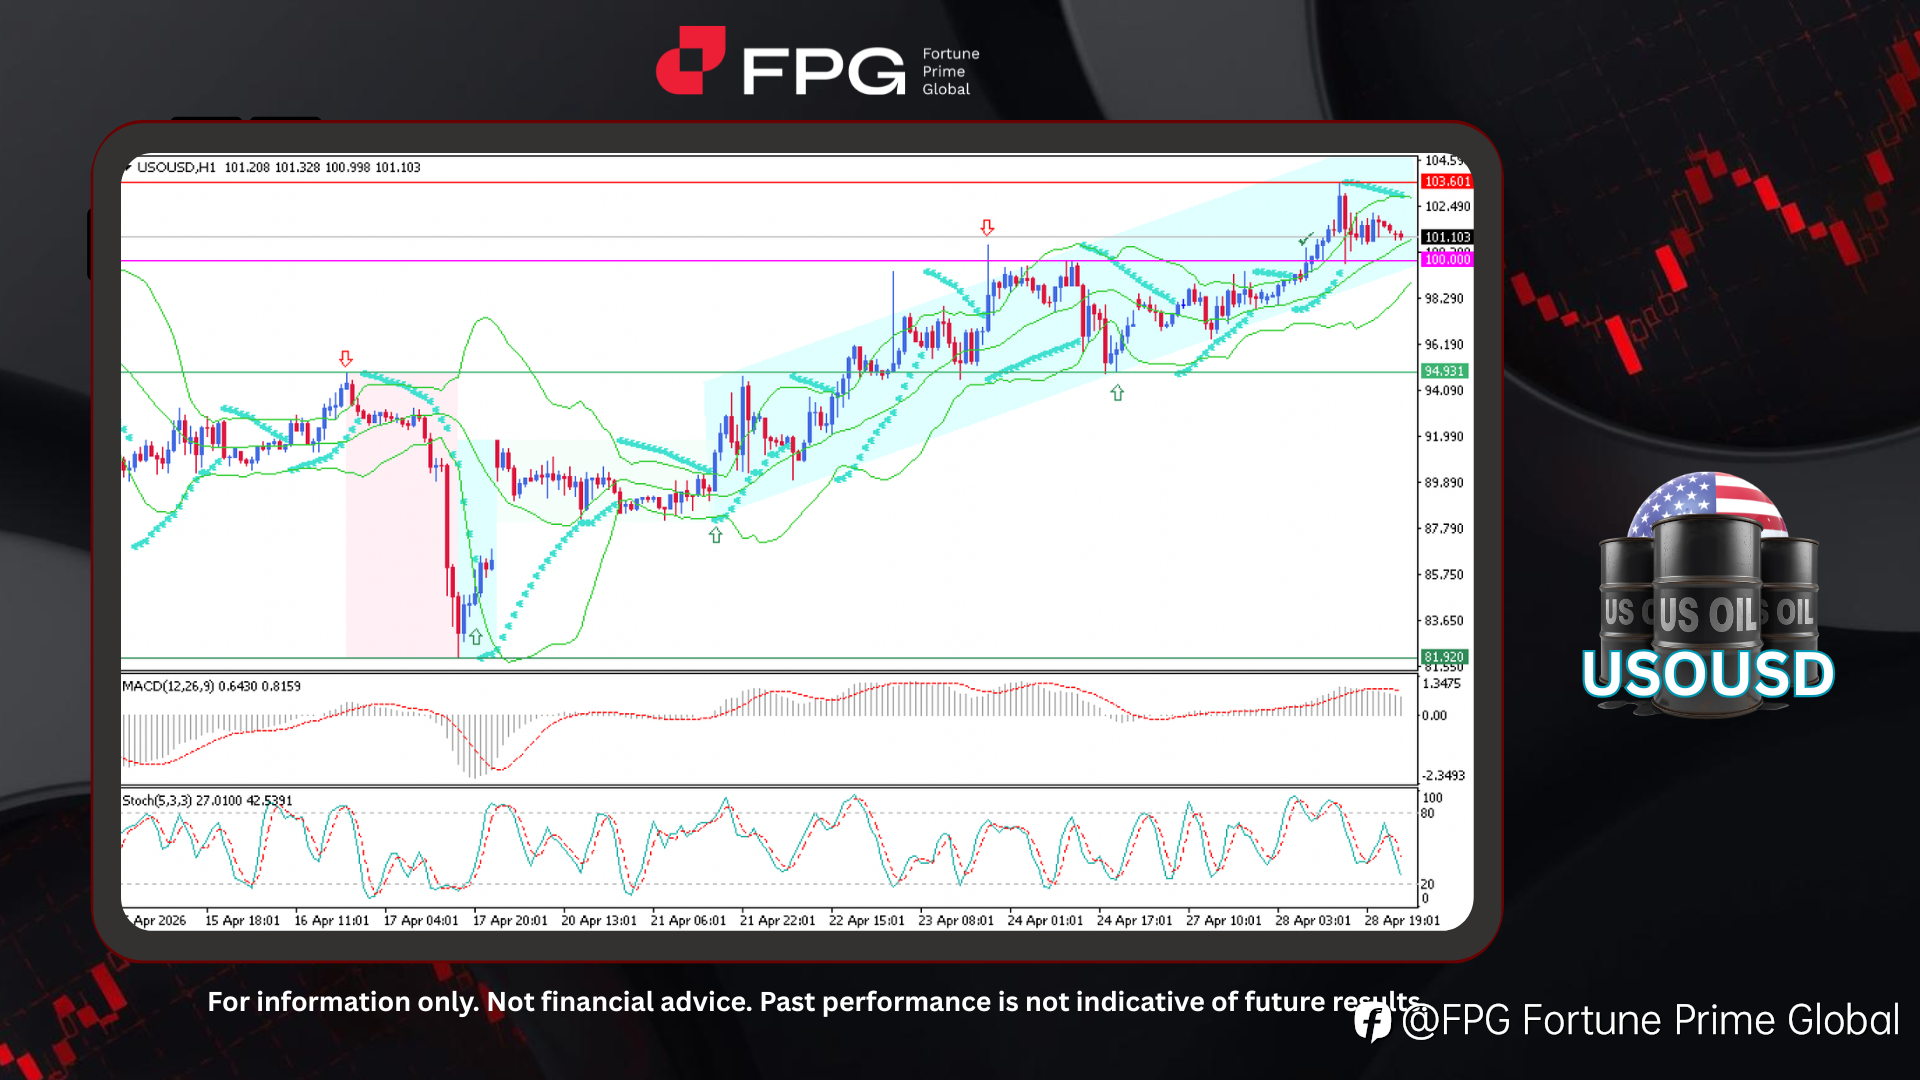
FPG USOUSD Market Report April 29, 2026
On the H1 timeframe chart, USOUSD has successfully climbed back above 100, following a breakout, briefly reaching 103.60, with the current price trading around 101.10. As observed on the chart, a sharp price drop occurred in the middle of this month, falling from 94.93 to 81.92. However, this was fo
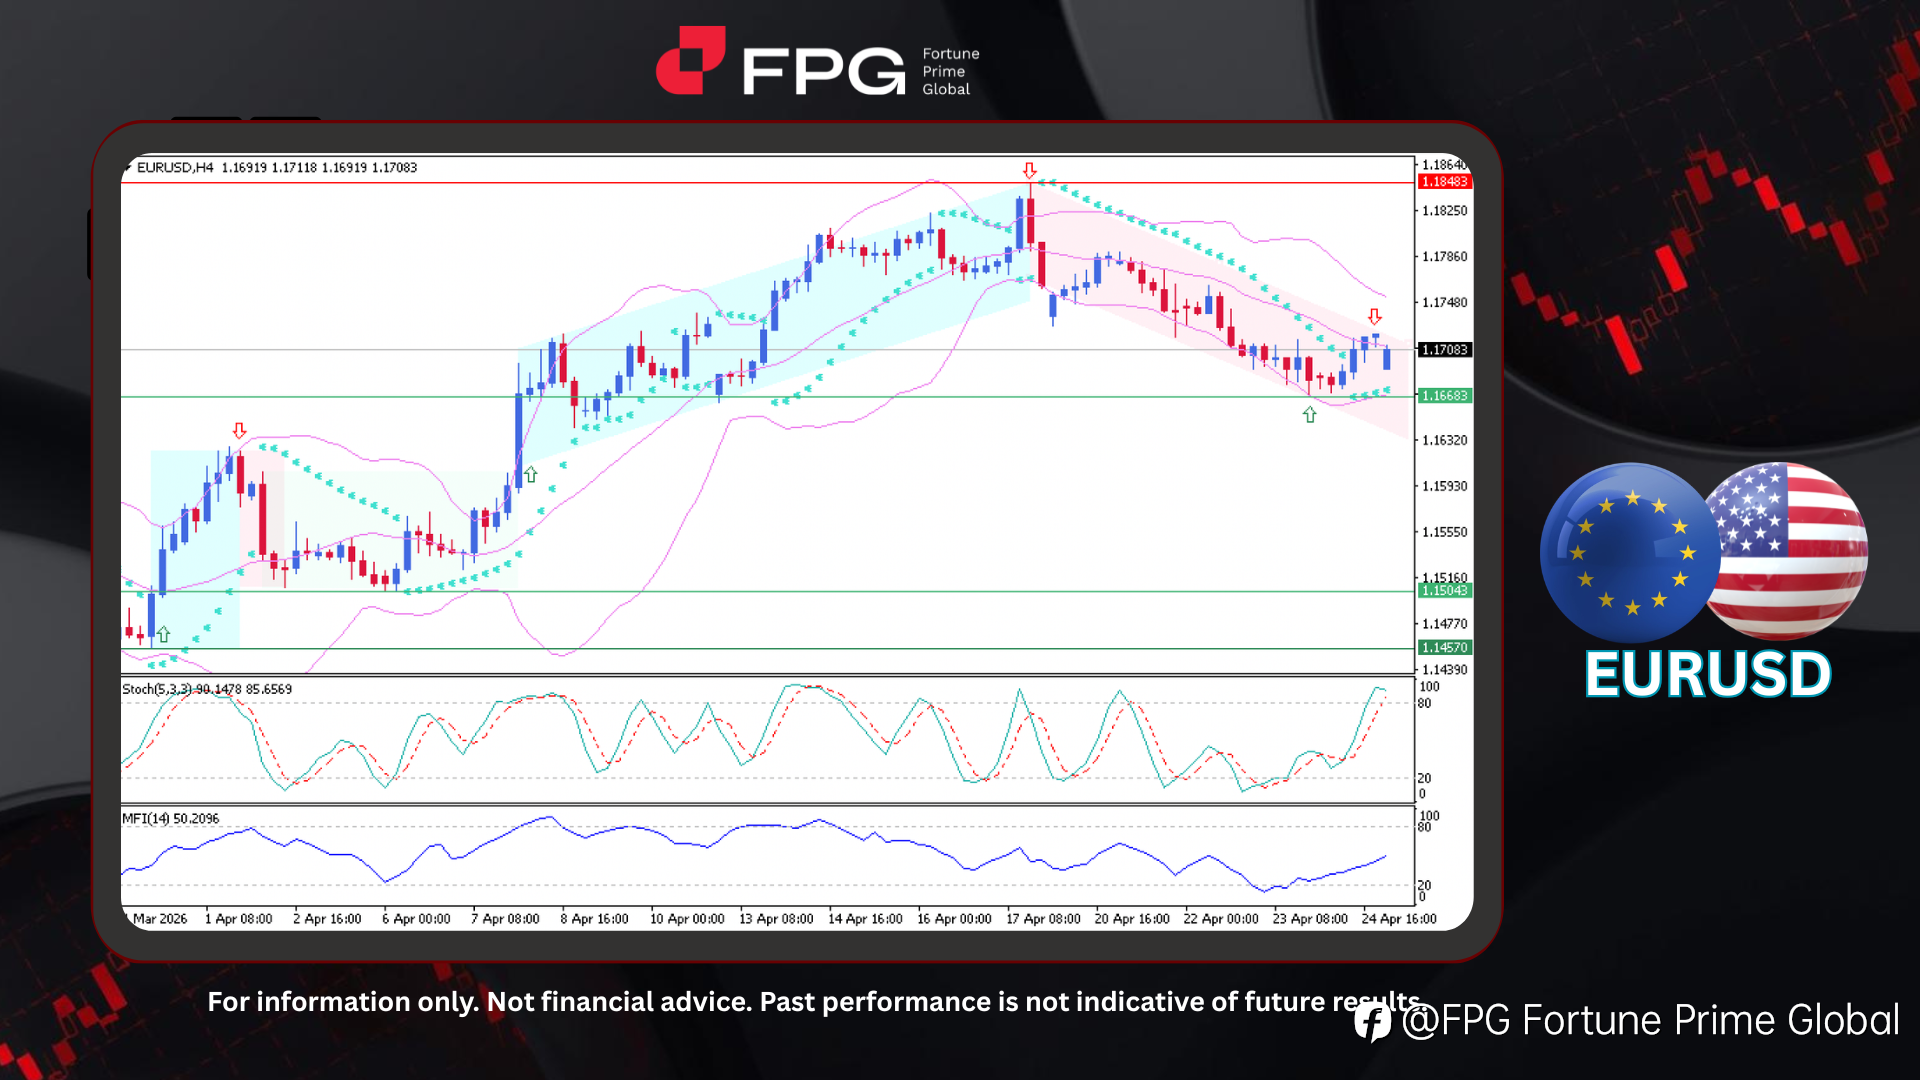
FPG EURUSD Market Report April 27, 2026
On the H4 timeframe chart, EURUSD shows a transition from a strong bullish phase into a sustained bearish correction. Price initially rallied from 1.1457 to 1.1848, forming a clear upward structure before encountering strong resistance and reversing direction. Following this rejection, the market ha
正在加载中...
