


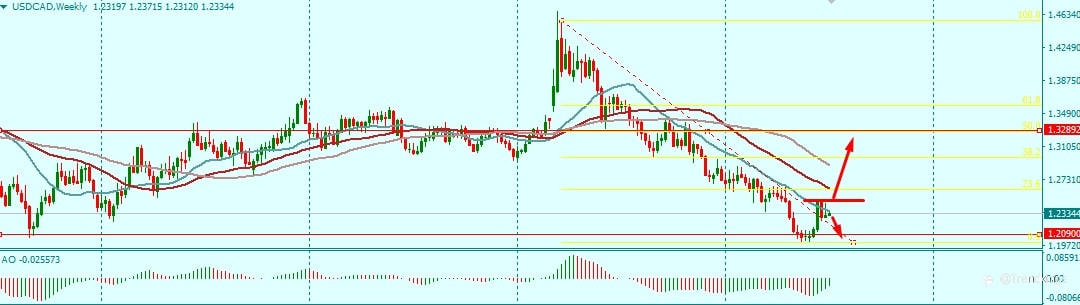
For the past 1 year, USDCAD Weekly has been on a classic downtrend. On March 2020, Price found a major resistance at 1.4642, and from the weekly candle view, price has repeated a perfect LL and LH pattern and has formed below the EMAs till date. Price hits 1.2090 monthly support level, forming a LL where price retraced to 1.2490 which is another key resistance level. Price at 1.2490 respects not only the 20 EMA, but it’s also in symmetry with a previous LH.
In my opinion there are various possible outcomes for the USDCAD; price may fall to form a double bottom; Price may breakout to the upside as the current weekly LL was formed at a strong Monthly Support level, there has also been a breakout of a weekly trend line. Who knows if the current climatic condition in Canada may also weaken its currency?
Disclaimer: What I have shared above is not a financial or investment advice of any sort, it’s just for educational purposes only, whatever trading decision you make is at your own risk.
风险提示:本文所述仅代表作者个人观点,不代表 Followme 的官方立场。Followme 不对内容的准确性、完整性或可靠性作出任何保证,对于基于该内容所采取的任何行为,不承担任何责任,除非另有书面明确说明。
 暂无评论。 来发表第一条观点吧。