· 阅读量 255
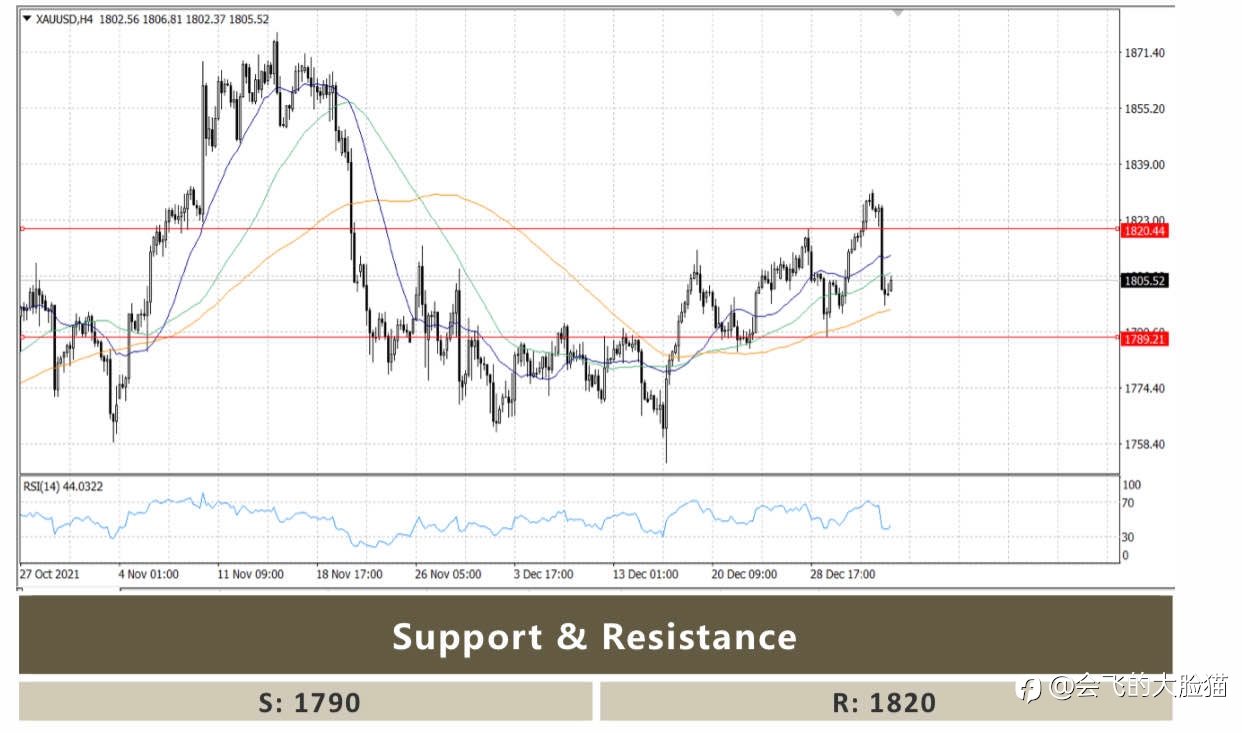
#XAU/USD# The 4-hour chart shows that the price has fallen below its 20 and 200 SMAs, while approaching a mildly bullish 100 SMA, reflecting sellers’ strength. Meanwhile, the Momentum indicator is crossing its midline into negative territory, while the RSI indicator heads lower at around 44, all of which hints at a bearish continuation, particularly on a break below $1,790, the immediate support level. #gold#
风险提示:本文所述仅代表作者个人观点,不代表 Followme 的官方立场。Followme 不对内容的准确性、完整性或可靠性作出任何保证,对于基于该内容所采取的任何行为,不承担任何责任,除非另有书面明确说明。
喜欢的话,赞赏支持一下
 暂无评论。 来发表第一条观点吧。