


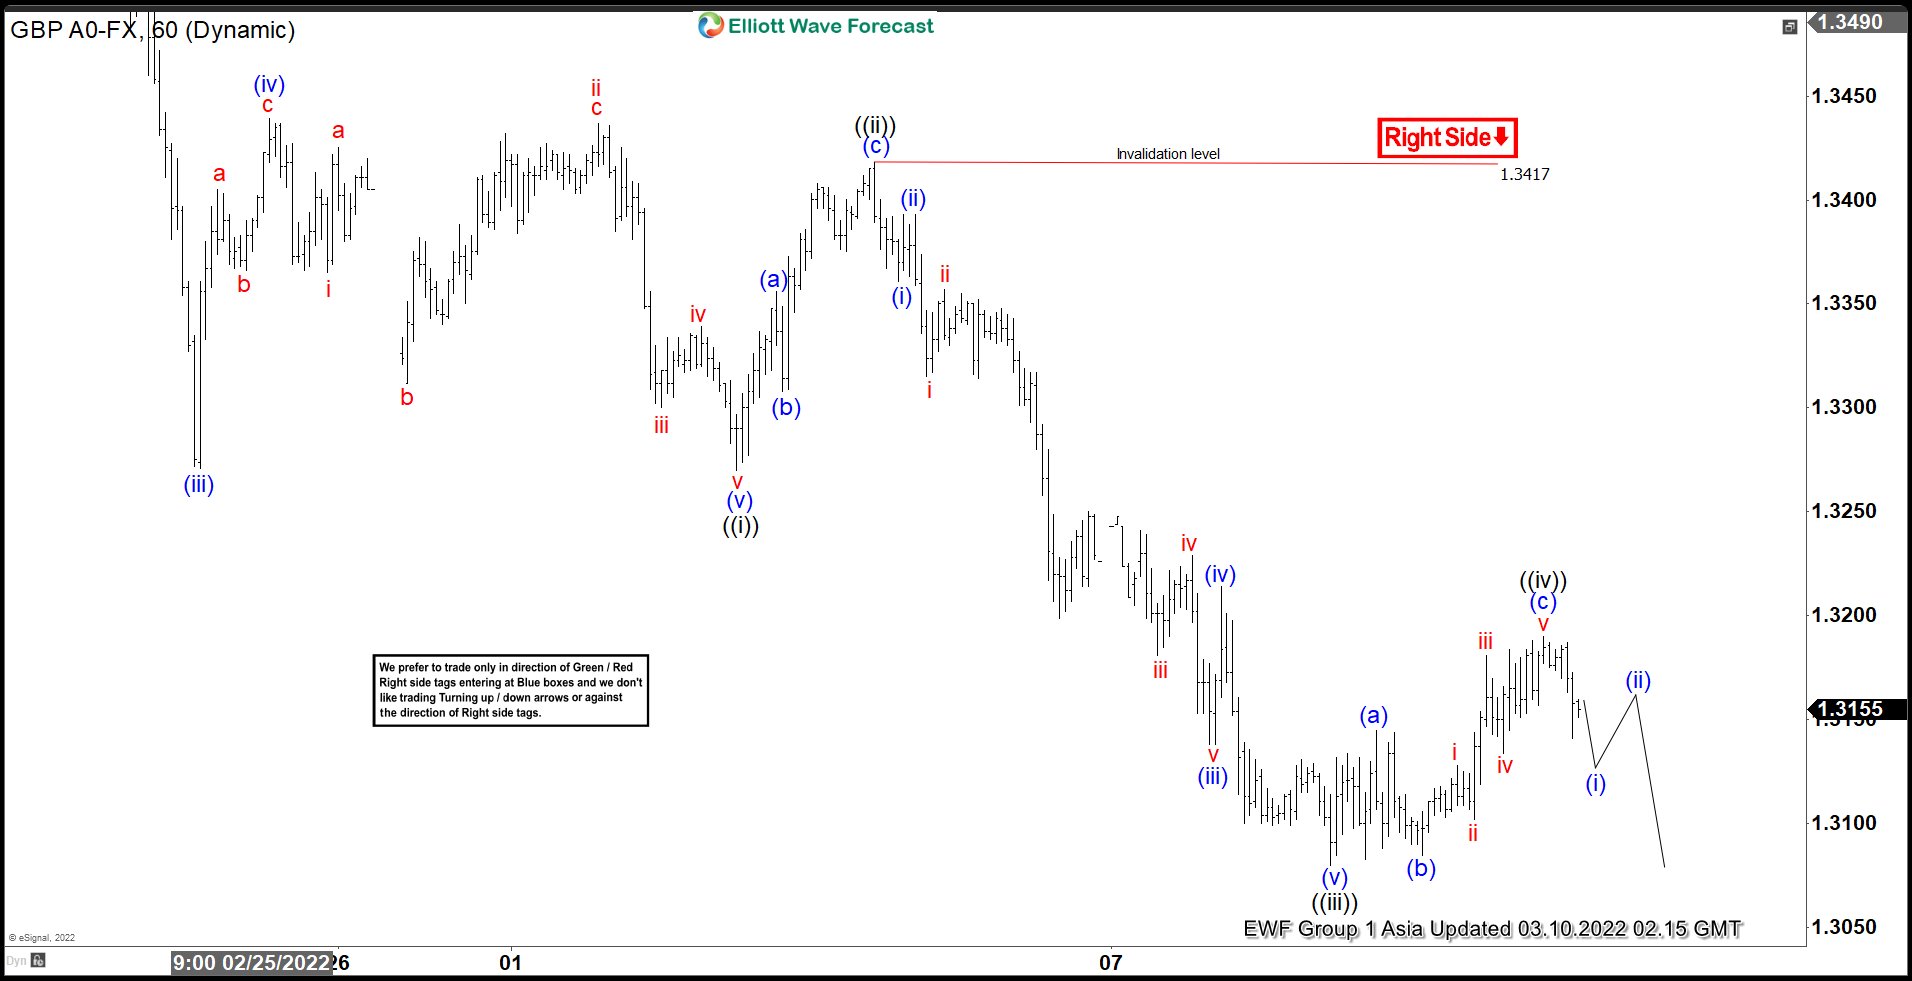
Short Term Elliott Wave View in GBPUSD suggests that the decline from February 18 peak is unfolding as a 5 waves impulse Elliott Wave structure. Down from February 18, wave (i) ended at 1.3536, and rally in wave (ii) ended at 1.3621. Pair then resumes lower in wave (iii) towards 1.3272, and rally in wave (iv) ended at 1.3439. Final leg lower wave (v) ended at 1.327 which also completed wave ((i)). Rally in wave ((ii)) completed at 1.3417 with internal subdivision as a zigzag. Up from wave ((i)), wave (a) ended at 1.335, pullback in wave (b) ended at 1.3308, and wave (c) higher ended at 1.3417 which completed wave ((ii)).
Pair resumes lower in wave ((iii)) with internal subdivision as an impulse. Down from wave ((ii)), wave (i) ended at 1.336, and wave (ii) ended at 1.3393. Pair resumes lower in wave (iii) which ended at 1.3138, and wave (iv) rally ended at 1.3214. Final leg lower wave (v) of ((iii)) ended at 1.3080. Wave ((iv)) rally in GBPUSD ended at 1.3190 with internal subdivision as a flat Elliott Wave structure. Near term, expect pair to extend lower in wave ((v)). As far as pivot at 1.3417 high stays intact, rally should fail in the sequence of 3, 7, or 11 swing for further downside.
GBPUSD 60 Minutes Elliott Wave Chart
风险提示:本文所述仅代表作者个人观点,不代表 Followme 的官方立场。Followme 不对内容的准确性、完整性或可靠性作出任何保证,对于基于该内容所采取的任何行为,不承担任何责任,除非另有书面明确说明。
 暂无评论。 来发表第一条观点吧。