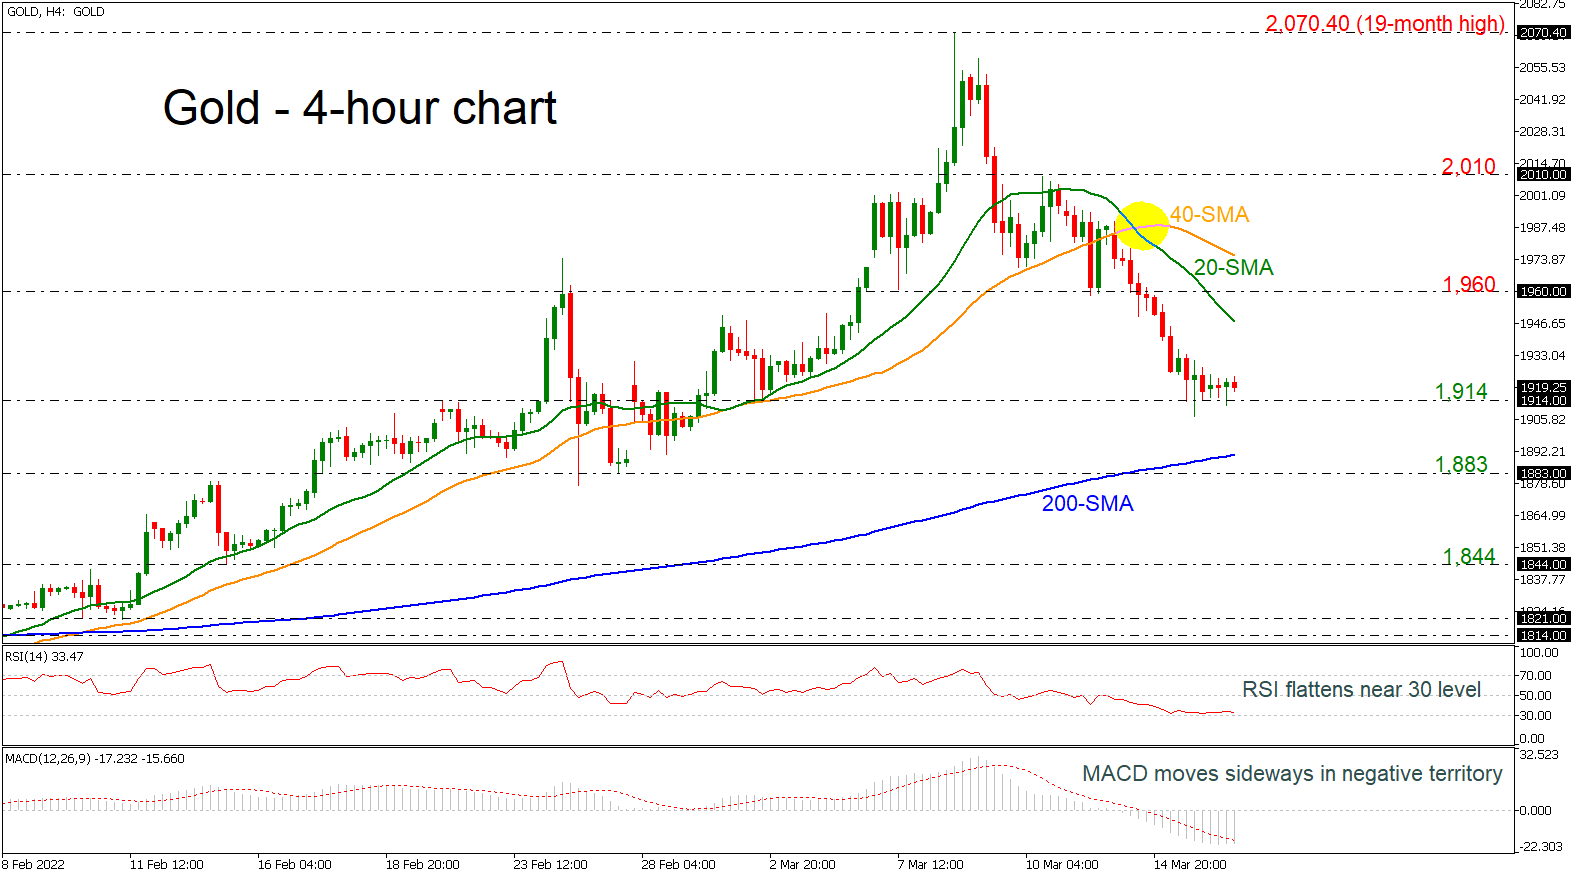
Gold prices are moving sideways after the aggressive selling interest from the 19-month peak of 2,070.40, returning back near the 1,900 mark. The RSI indicator is flattening around the oversold region, while the MACD is still developing with weak momentum in the negative area. In trend indicators, the 20- and 40-period simple moving averages (SMAs) posted a bearish crossover in the near-term.
Should the market extend losses, support could be met between the 200-period SMA at 1,890 and the 1,883 barrier. A significant leg below this area could sent prices towards the 1,844 hurdle.
On the flip side, if the pair bounces up, immediate resistance could be met at the 20-period SMA currently at 1,947 ahead of the 1,960 level. Above these lines, the 40-period SMA at 1,975 and the 2,010 key level may act as tuning points.
In the bigger picture, the price is bullish as long as it holds above the 200-period SMA. In case it violates this line, bears could take the upper hand.
风险提示:本文所述仅代表作者个人观点,不代表 Followme 的官方立场。Followme 不对内容的准确性、完整性或可靠性作出任何保证,对于基于该内容所采取的任何行为,不承担任何责任,除非另有书面明确说明。

暂无评论,立马抢沙发