Procter & Gamble Co (NYSE: PG), a household name in consumer goods, has been a staple in many homes for generations. From Crest toothpaste to Tide laundry detergent, P&G's products are ubiquitous and trusted by millions. But as the company faces increasing competition and changing consumer preferences, can it continue to deliver for its investors? This article dives into the Elliott Wave analysis of P&G, revealing potential bullish patterns that may excite both long-term investors and short-term traders. Let's take a closer look at what the future may hold for this iconic company.
PG Daily Elliott Wave Chart
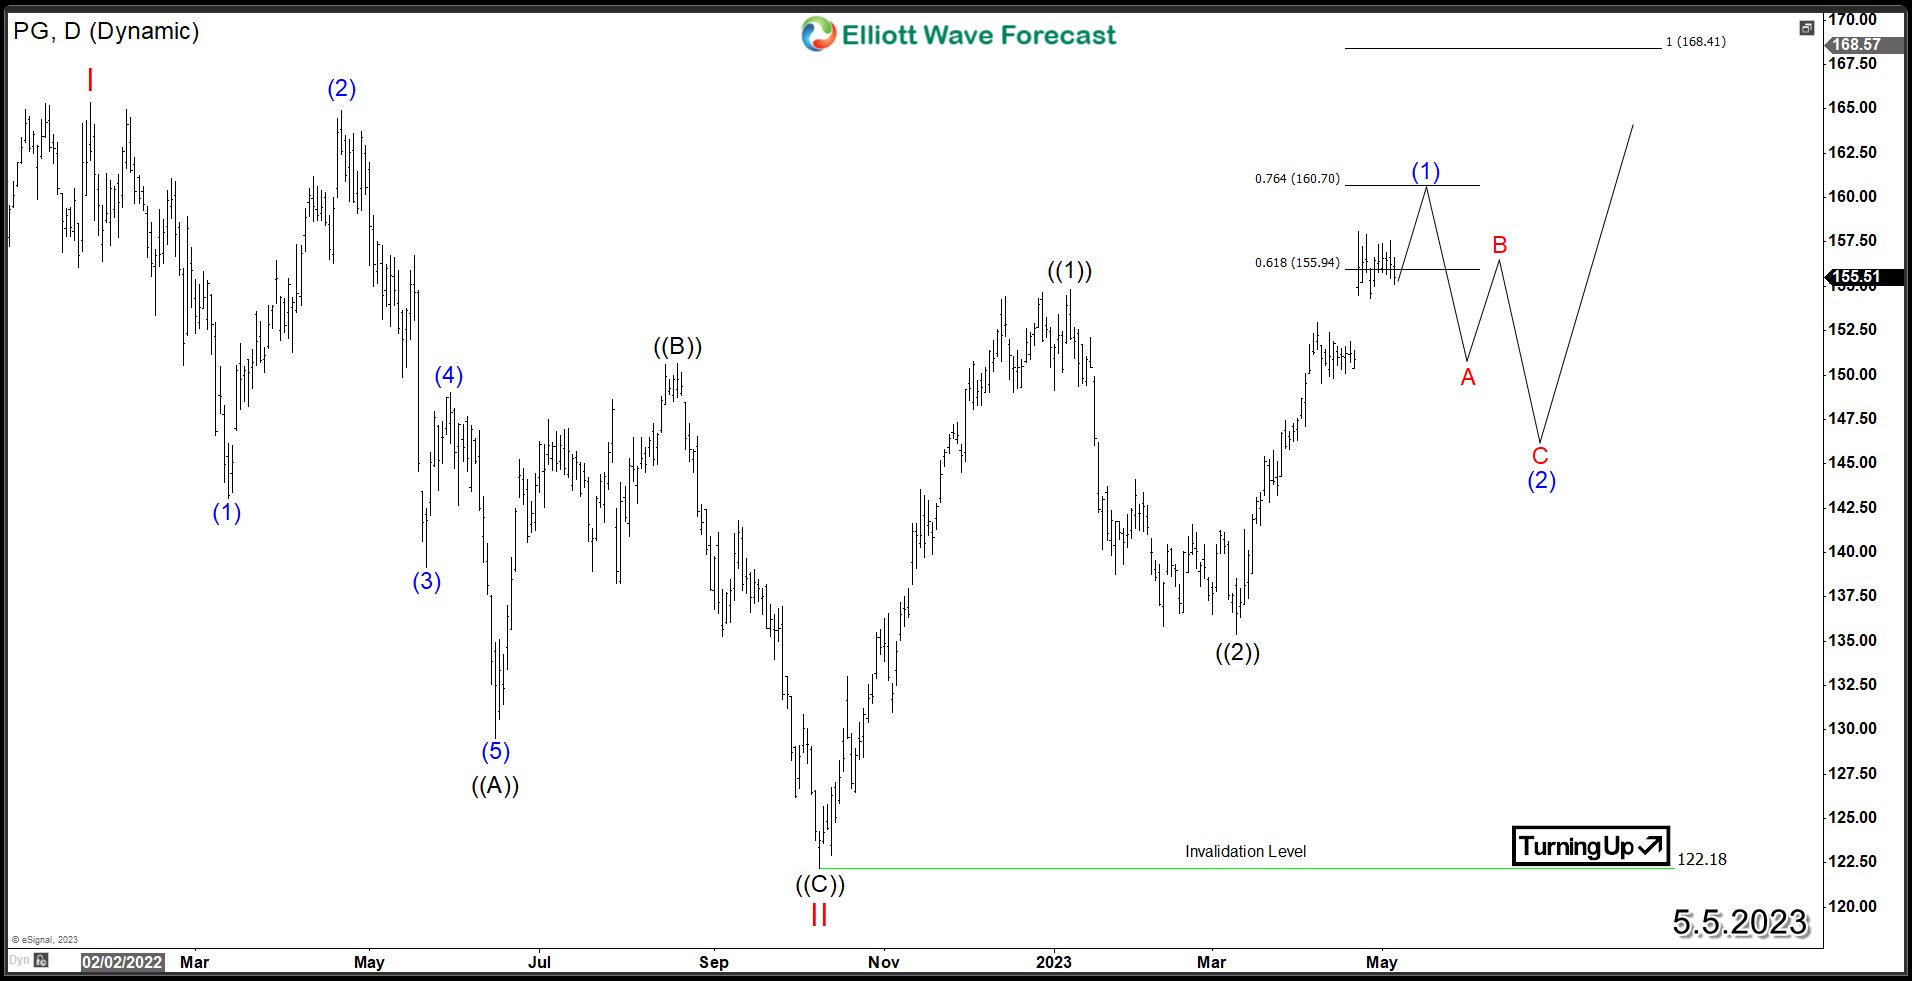
PG experienced a decline in 2022, which is believed to be a wave II correction that concluded at $122.18 in October of that year. After the correction, PG rallied higher in wave ((1)), followed by a correction in wave ((2)) before starting another cycle higher in wave ((3)). Recently, the stock broke above January 2023 peak creating a bullish sequence of 2022 low and supporting the stock toward weekly target at $168. However, the daily cycle has reached an extreme area at 155.9 - 160.7, which could create a 3 waves pullback to correct the rally since March 2023 low. This correction lower could present a daily buying opportunity as long as it remains above $135.38 low. Investors can look for continuation towards a new all-time high from there.
风险提示:本文所述仅代表作者个人观点,不代表 Followme 的官方立场。Followme 不对内容的准确性、完整性或可靠性作出任何保证,对于基于该内容所采取的任何行为,不承担任何责任,除非另有书面明确说明。

暂无评论,立马抢沙发