$IBM has been trading sideways since it peaked on 02.01.2017. It still has not reached the target at the $82.36 area. This article on 11.2020 shows the target area and and the most likely path at that moment. Since the World Indices bottomed in 2020, the stock has created a five-wave advance. However, the lows back in 2020 came with a momentum divergence. The stock is doing a seven-swing structure, which the Elliott Wave Theory calls a WXY below
WXY (7 Swing) Elliott Wave Structure

The graph above represents a WXY in the Elliott Wave Theory. It is corrective by nature and needs to erase momentum divergence when the seven swing ends. After the structure ends, the trend will renew higher, and consequently, a massive rally will happen.
$IBM Monthly Elliott Wave Chart
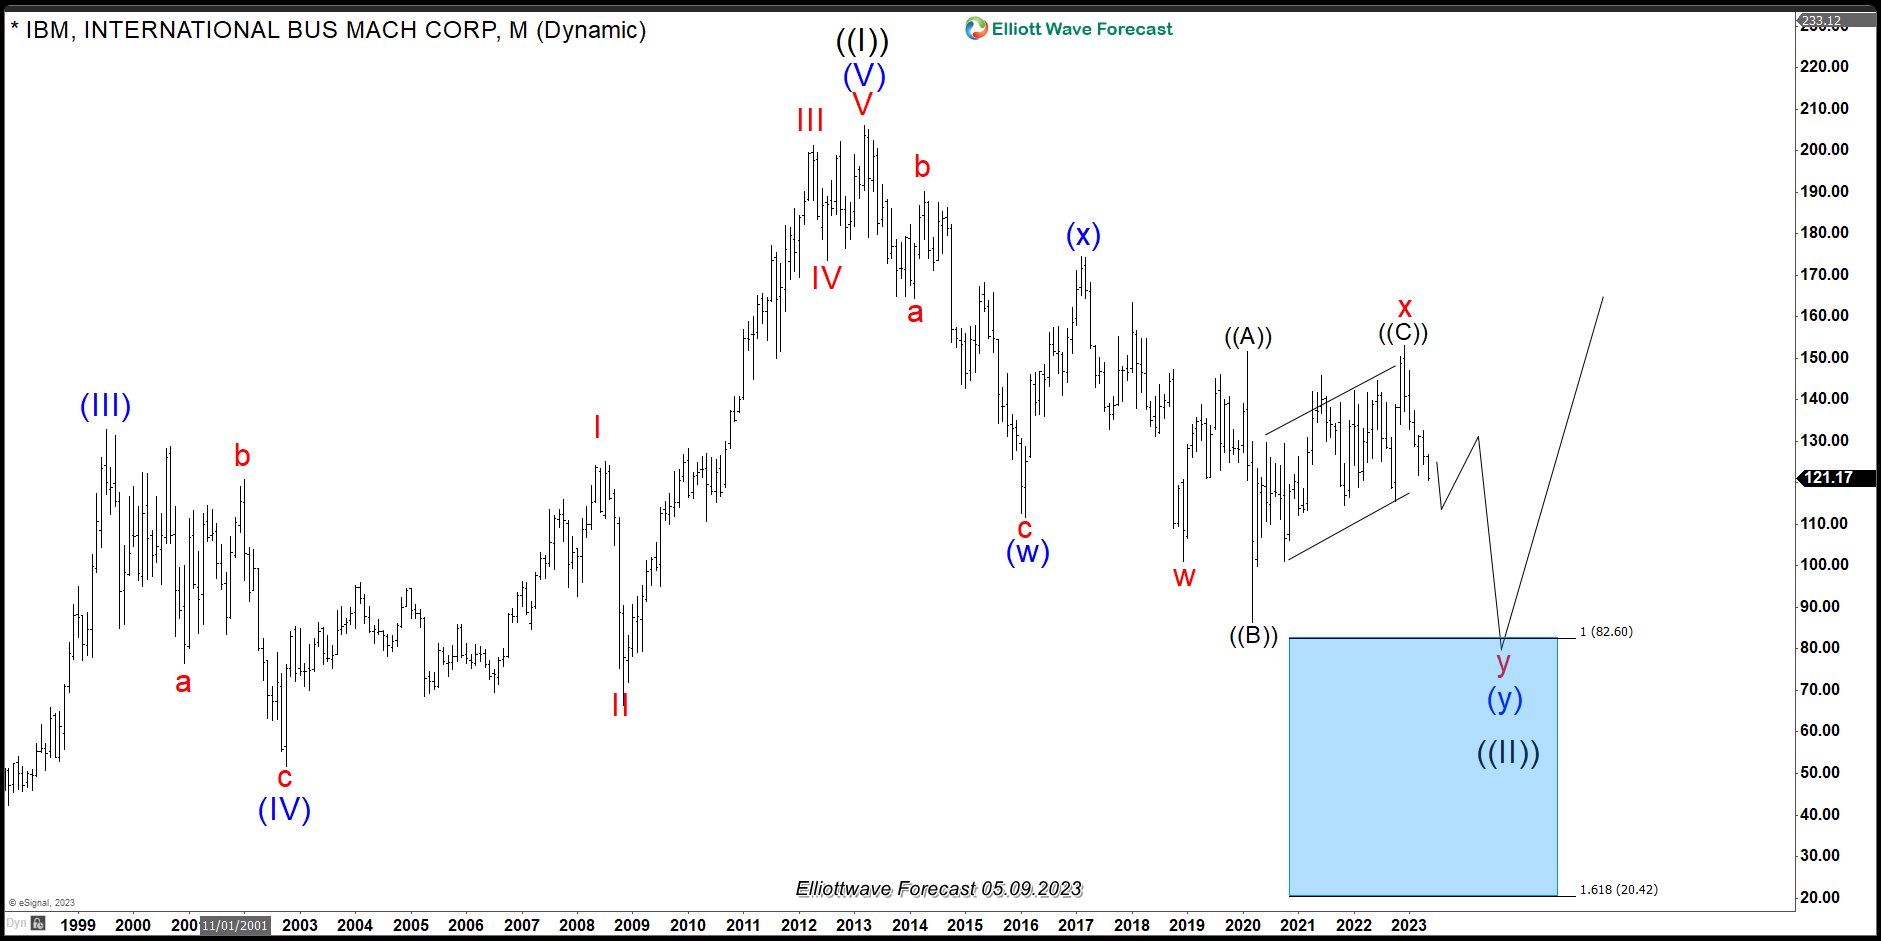
The monthly chart above shows $IBM with the Elliott Wave labels and blue box target. We believe the stock has ended wave x in red and started the process lower into the target. If we compare the old article from 2020 (link provided earlier above) with the current count, the difference is that wave x took a form of a FLAT. The main idea however remains the same. The following chart shows a flat structure
Flat Elliott Wave Structure
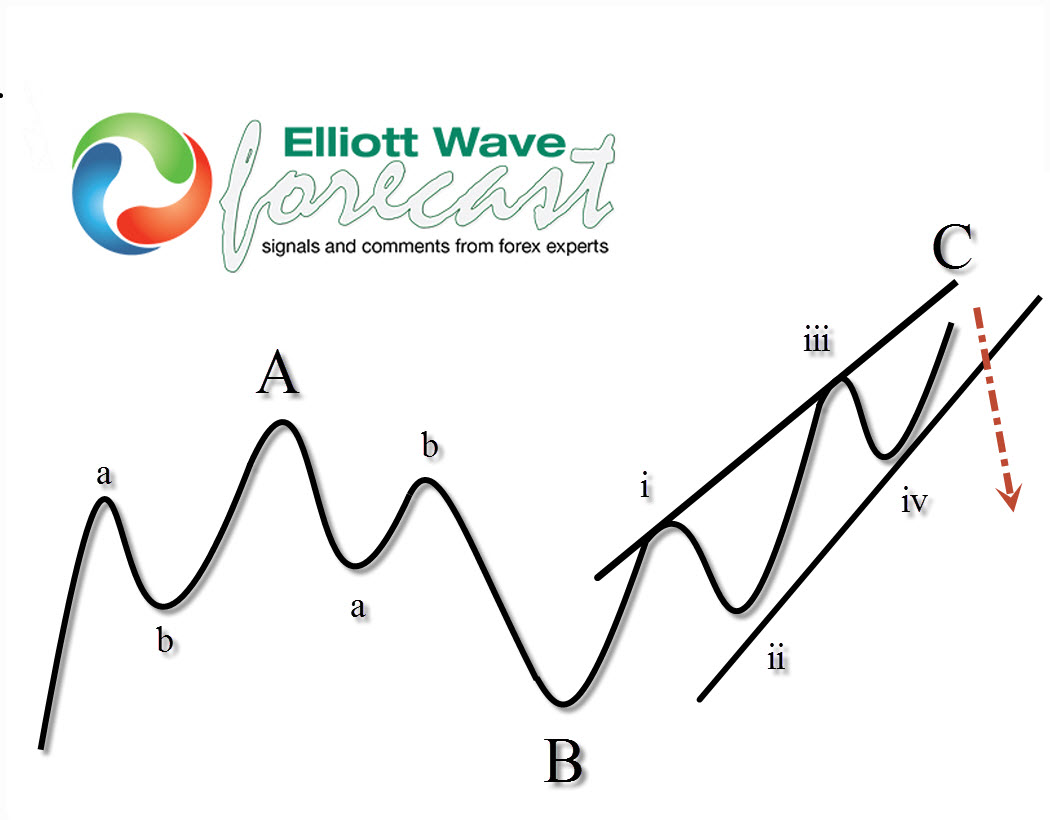
The graph above shows what a FLAT looks like in the Elliott Wave Theory. Flat is a 3-3-5 structure, which usually tricks traders. It confuse traders with the five waves advance within wave C so traders think it's a new impulse trend. The Flat correction in $IBM has made the push lower into the target time-consuming. But it is seems that it will finally get there and provide an opportunity to buy it. It also offers excellent timing for the World Indices.
风险提示:本文所述仅代表作者个人观点,不代表 Followme 的官方立场。Followme 不对内容的准确性、完整性或可靠性作出任何保证,对于基于该内容所采取的任何行为,不承担任何责任,除非另有书面明确说明。

暂无评论,立马抢沙发