


| Scenario | |
|---|---|
| Timeframe | Weekly |
| Recommendation | BUY STOP |
| Entry Point | 170.10 |
| Take Profit | 178.12, 181.25 |
| Stop Loss | 167.30 |
| Key Levels | 159.38, 162.50, 165.62, 175.00, 178.12, 181.25 |
| Alternative scenario | |
|---|---|
| Recommendation | SELL STOP |
| Entry Point | 165.62 |
| Take Profit | 162.50, 159.38 |
| Stop Loss | 167.80 |
| Key Levels | 159.38, 162.50, 165.62, 175.00, 178.12, 181.25 |
Current trend
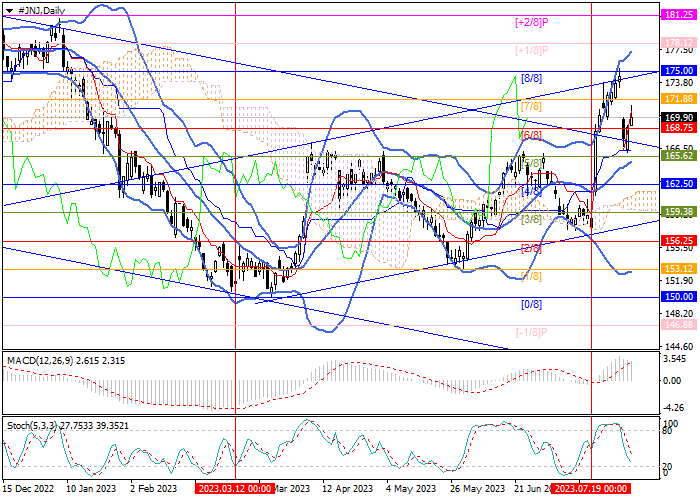
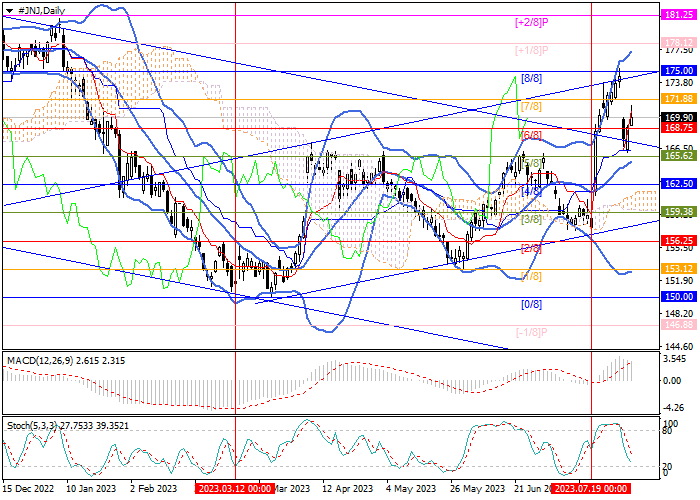
At the end of last month, the shares of Johnson & Johnson, one of the world's leading retail holdings, left the long-term downward channel and are currently forming an upward trend: the price reached the upper limit of the Murray trading range at 175.00, but could not break above it and corrected to the level of 165.62 (Murray level [5/8]), supported by the middle line of the Bollinger Bands.
Now the quotes are consolidated above the reversal level of 168.75 (Murray level [6/8]), which will allow further growth to the area of 175.00 (Murray level [8/8]), 178.12 (Murray level [ 1/8]) and 181.25 (Murray level [ 2/8]). The 165.62 mark remains key for the "bears", with its breakdown, further movement is possible within the central Murray channel to the levels of 162.50 (Murray level [4/8]) and 159.38 (Murray level [3/8]).
Technical indicators do not give a single signal: the Bollinger Bands reverse upwards, and the Stochastic reverses downwards, the MACD histogram decreases in the positive zone.
Support and resistance
Resistance levels: 175.00, 178.12, 181.25.
Support levels: 165.62, 162.50, 159.38.
Trading tips
Long positions can be opened from 170.10 with targets at 178.12, 181.25 and stop-loss at around 167.30. Implementation period: 5-7 days.
Short positions may be opened below 165.62 with targets at 162.50, 159.38 and stop-loss in the area of 167.80.
风险提示:本文所述仅代表作者个人观点,不代表 Followme 的官方立场。Followme 不对内容的准确性、完整性或可靠性作出任何保证,对于基于该内容所采取的任何行为,不承担任何责任,除非另有书面明确说明。
 暂无评论。 来发表第一条观点吧。