


Scenario Timeframe Weekly Recommendation BUY STOP Entry Point 1.3405 Take Profit 1.3552, 1.3673 Stop Loss 1.3335 Key Levels 1.2973, 1.3111, 1.3267, 1.3401, 1.3552, 1.3673
Alternative scenario Recommendation SELL STOP Entry Point 1.3265 Take Profit 1.3111, 1.2973 Stop Loss 1.3335 Key Levels 1.2973, 1.3111, 1.3267, 1.3401, 1.3552, 1.3673
USD/CAD, H4
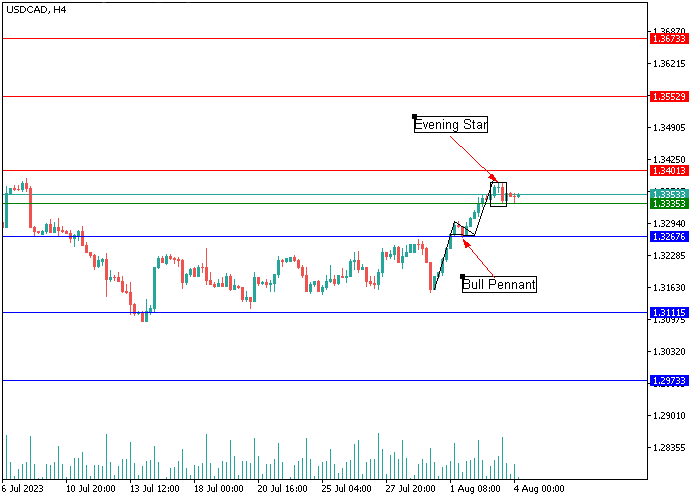
On the four-hour chart, the construction of the Bullish Pennant model has completed, which signals a more global price reversal upwards; however, having reached the area of the key resistance level of 1.3401, the quotes of the USD/CAD pair formed an Evening Star candlestick pattern above the level of 1.3335, confirming the beginning of a correction to the support level of 1.3267 with subsequent upward reversal. In the current situation, overcoming and consolidation above 1.3401 may become a driver for opening long positions with targets in the range of 1.3552–1.3673, but if the key support level 1.3267 is overcome, the negative dynamics will intensify to the area of 1.3111–1.2973.
USD/CAD, D1
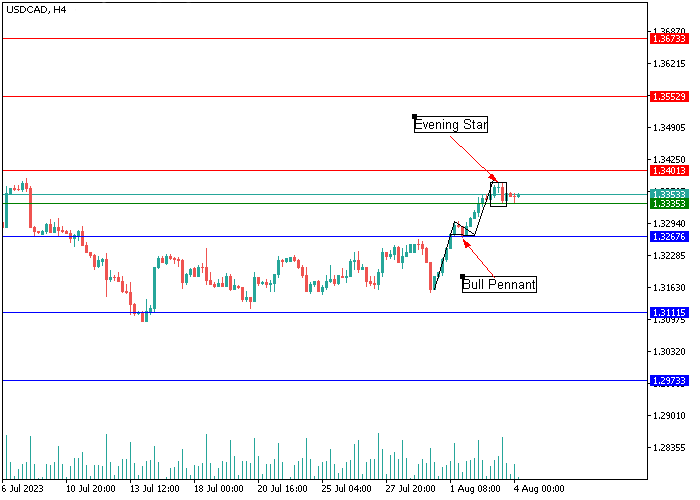
On the daily chart, a Falling Wedge pattern is being built, where at the level of 1.3267 there was a breakout of the upper border of the price model, followed by the development of an uptrend, which also confirms the appearance of reversal "bullish" figures, Inverted Hammer and Hammer, under the level of 1.3267. At the moment, quotes have formed one of the varieties of the Three Advancing White Soldiers pattern called Stalled Pattern, which signals weakening of the positions of the "bulls". In this situation, a slight corrective movement down to the area of support level 1.3267 is likely, followed by a reversal upwards. Overcoming the resistance level of 1.3401 by quotes will enable buyers to recover lost positions up to the level of 1.3673.
Support and resistance
Support levels: 1.3267, 1.3111, 1.2973.
Resistance levels: 1.3401, 1.3552, 1.3673.
Trading tips
Long positions can be opened above 1.3401 with targets at 1.3552, 1.3673. Stop-loss — 1.3335. Implementation time: 9-12 days.
Short positions can be opened below 1.3267 with targets at 1.3111, 1.2973. Stop-loss — 1.3335.
| Scenario | |
|---|---|
| Timeframe | Weekly |
| Recommendation | BUY STOP |
| Entry Point | 1.3405 |
| Take Profit | 1.3552, 1.3673 |
| Stop Loss | 1.3335 |
| Key Levels | 1.2973, 1.3111, 1.3267, 1.3401, 1.3552, 1.3673 |
| Alternative scenario | |
|---|---|
| Recommendation | SELL STOP |
| Entry Point | 1.3265 |
| Take Profit | 1.3111, 1.2973 |
| Stop Loss | 1.3335 |
| Key Levels | 1.2973, 1.3111, 1.3267, 1.3401, 1.3552, 1.3673 |
USD/CAD, H4
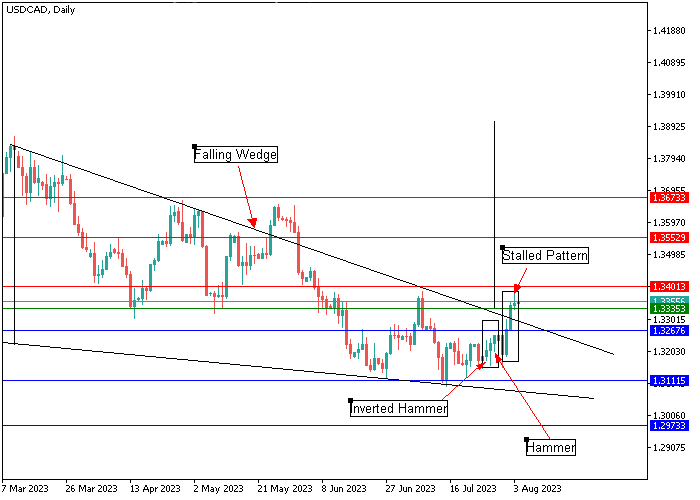
On the four-hour chart, the construction of the Bullish Pennant model has completed, which signals a more global price reversal upwards; however, having reached the area of the key resistance level of 1.3401, the quotes of the USD/CAD pair formed an Evening Star candlestick pattern above the level of 1.3335, confirming the beginning of a correction to the support level of 1.3267 with subsequent upward reversal. In the current situation, overcoming and consolidation above 1.3401 may become a driver for opening long positions with targets in the range of 1.3552–1.3673, but if the key support level 1.3267 is overcome, the negative dynamics will intensify to the area of 1.3111–1.2973.
USD/CAD, D1
On the daily chart, a Falling Wedge pattern is being built, where at the level of 1.3267 there was a breakout of the upper border of the price model, followed by the development of an uptrend, which also confirms the appearance of reversal "bullish" figures, Inverted Hammer and Hammer, under the level of 1.3267. At the moment, quotes have formed one of the varieties of the Three Advancing White Soldiers pattern called Stalled Pattern, which signals weakening of the positions of the "bulls". In this situation, a slight corrective movement down to the area of support level 1.3267 is likely, followed by a reversal upwards. Overcoming the resistance level of 1.3401 by quotes will enable buyers to recover lost positions up to the level of 1.3673.
Support and resistance
Support levels: 1.3267, 1.3111, 1.2973.
Resistance levels: 1.3401, 1.3552, 1.3673.
Trading tips
Long positions can be opened above 1.3401 with targets at 1.3552, 1.3673. Stop-loss — 1.3335. Implementation time: 9-12 days.
Short positions can be opened below 1.3267 with targets at 1.3111, 1.2973. Stop-loss — 1.3335.
风险提示:本文所述仅代表作者个人观点,不代表 Followme 的官方立场。Followme 不对内容的准确性、完整性或可靠性作出任何保证,对于基于该内容所采取的任何行为,不承担任何责任,除非另有书面明确说明。
 暂无评论。 来发表第一条观点吧。