


| Scenario | |
|---|---|
| Timeframe | Weekly |
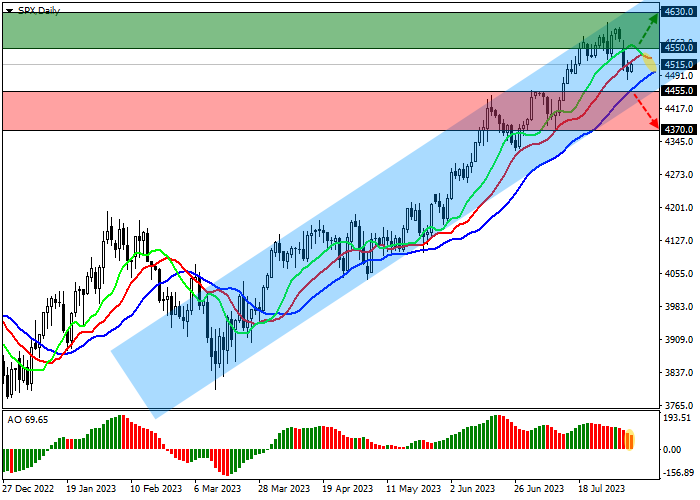
| Recommendation | BUY STOP |
| Entry Point | 4550.0 |
| Take Profit | 4630.0 |
| Stop Loss | 4500.0 |
| Key Levels | 4370.0, 4455.0, 4550.0, 4630.0 |
| Alternative scenario | |
|---|---|
| Recommendation | SELL STOP |
| Entry Point | 4455.0 |
| Take Profit | 4370.0 |
| Stop Loss | 4500.0 |
| Key Levels | 4370.0, 4455.0, 4550.0, 4630.0 |
Current trend
US stock markets continue to correct. This week, their dynamics continues to depend on the publication of corporate reports, where the sector of technology companies is in the active phase. Against this background, the leading index of the American economy S&P 500 is held at around 4515.0.
As expected by most analysts, revenue of tech giant Apple Inc. was 81.80 billion dollars, up from the projected 81.73 billion dollars, and earnings per share were 1.26 dollars, up from 1.19 dollars a quarter earlier.
In turn, the report of the largest online retailer Amazon.com Inc. came out stronger as the company managed to boost revenue to 134.40 billion dollars, beating both the 131.45 billion dollar forecast and the previous quarter's 127.40 billion dollars. Earnings per share were 0.65 dollars, more than double the 0.31 dollars posted a quarter earlier.
Income of the biopharmaceutical company Amgen Inc. was 7.00 billion dollars, up from 6.67 billion dollar forecast, and after 6.10 billion dollars in the previous quarter. Earnings per share were a record 5.00 dollars, while analysts expected 4.49 dollars.
The growth leaders in the index are Clorox Co. ( 8.96%), APA Corp. ( 6.79%), Ceridian HCM Holding Inc. ( 6.78%), WestRock Co. ( 6.18%).
Among the leaders of the decline are DXC Technology Co. (-29.44%), Expedia Inc. (-16.38%), PayPal Holdings Inc. (-12.32%).
Support and resistance
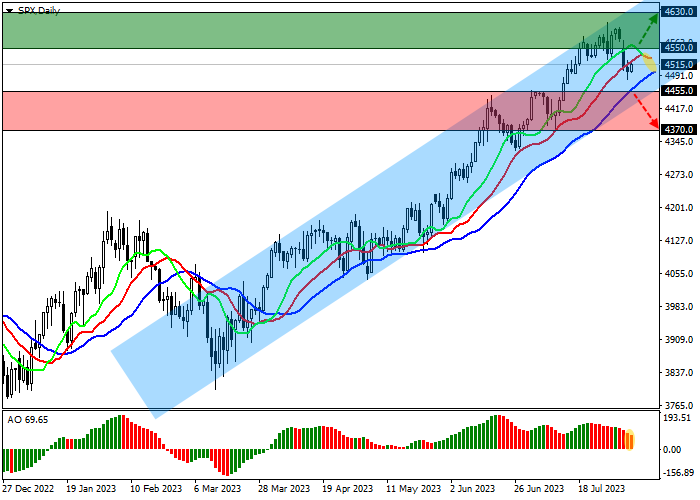
The index quotes continue the global trend, being exactly in the middle of the global ascending corridor with the borders of 4650.0–4450.0 on the daily chart.
Technical indicators keep a buy signal, which sometimes weakens on local corrections: the fast EMAs of the Alligator indicator are way above the signal line, and the AO histogram, being in the buy zone, is forming corrective bars.
Support levels: 4455.0, 4370.0.
Resistance levels: 4550.0, 4630.0.
Trading tips
If the asset continues growing locally and the price consolidates above the local resistance level of 4550.0, long positions will be relevant with target at 4630.0. Stop-loss — 4500.0. Implementation time: 7 days and more.
If the asset reverses and contiues declining and the price consolidates below the local support level of 4455.0, short positions can be opened with the target at 4370.0. Stop-loss — 4500.0.
风险提示:本文所述仅代表作者个人观点,不代表 Followme 的官方立场。Followme 不对内容的准确性、完整性或可靠性作出任何保证,对于基于该内容所采取的任何行为,不承担任何责任,除非另有书面明确说明。
 暂无评论。 来发表第一条观点吧。
