


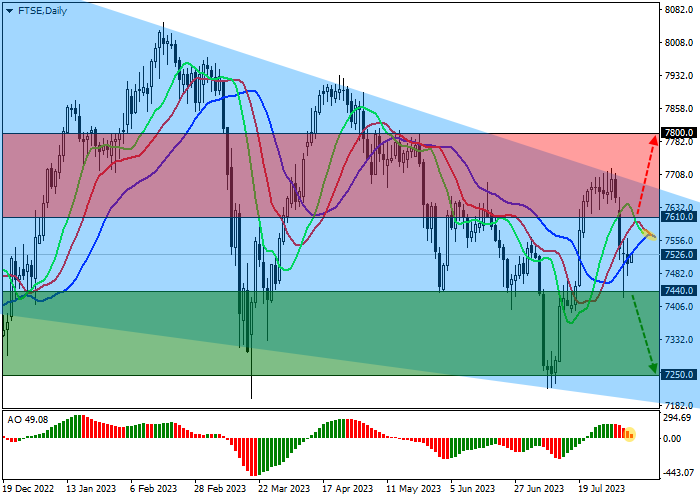
| Scenario | |
|---|---|
| Timeframe | Weekly |
| Recommendation | SELL STOP |
| Entry Point | 7440.0 |
| Take Profit | 7250.0 |
| Stop Loss | 7510.0 |
| Key Levels | 7250.0, 7440.0, 7610.0, 7800.0 |
| Alternative scenario | |
|---|---|
| Recommendation | BUY STOP |
| Entry Point | 7610.0 |
| Take Profit | 7800.0 |
| Stop Loss | 7500.0 |
| Key Levels | 7250.0, 7440.0, 7610.0, 7800.0 |
Current trend
At the moment, the leading index of the London Stock Exchange FTSE 100 is held around the level of 7526.0.
The UK stock market continues unstable dynamics against the background of an upward correction in the bond market, which even positive corporate reports cannot compensate for. Thus, the automaker Rolls-Royce Holdings plc recorded revenue growth to 6.950B pounds, exceeding the 6.059B pounds expected by analysts, and earnings per share of 0.0218 pounds compared to -0.0088 pounds earlier.
In turn, pharmaceutical giant Gedeon Richter Ltd. showed a steady increase in revenue to 203.78B forints compared to preliminary estimates of experts at 185.33B forints, while earnings per share amounted to 155.0 forints, which is also higher than the forecasted 143.0 forints.
Meanwhile, local growth is observed in the domestic UK bond market: 10-year securities are trading at a rate of 4.4305%, rising by 1.22% relative to Friday's close, and conservative 20-year ones are trading at 4.678%, adding 1.63%. The upward dynamics is also recorded for 30-year bonds, which are currently held near the key yield level of 4.621%, rising by 1.13% since the beginning of trading.
The growth leaders in the index are Rolls-Royce Holdings plc ( 7.44%), Mondi plc ( 5.46%), St. James's Place plc ( 4.32%), Flutter Entertainment plc ( 3.55%).
Among the leaders of the decline are WPP plc (-3.45%), Spirax-Sarco Engineering plc (-1.13%) and Compass Group plc (-1.04%).
Support and resistance
On the daily chart, FTSE 100 quotes are falling in the direction of the support line of the global Triangle pattern at 7200.0.
Technical indicators are in a state of uncertainty, and are already ready to issue a new sell signal: the range of EMA fluctuations on the alligator indicator is quite narrow, and the histogram of the AO oscillator forms new correction bars, rapidly approaching the transition level.
Support levels: 7440.0, 7250.0.
Resistance levels: 7610.0, 7800.0.
Trading tips
Short positions may be opened after the reversal and continuation of the global decline in the index, as well as the price consolidation below the local support level of 7440.0 with a target at 7250.0. Stop-loss – 7510.0. Implementation time: 7 days and more.
Long positions can be opened after the price consolidates above the local resistance level of 7610.0 with a target at 7800.0 and stop-loss at 7500.0.
风险提示:本文所述仅代表作者个人观点,不代表 Followme 的官方立场。Followme 不对内容的准确性、完整性或可靠性作出任何保证,对于基于该内容所采取的任何行为,不承担任何责任,除非另有书面明确说明。
 暂无评论。 来发表第一条观点吧。
