


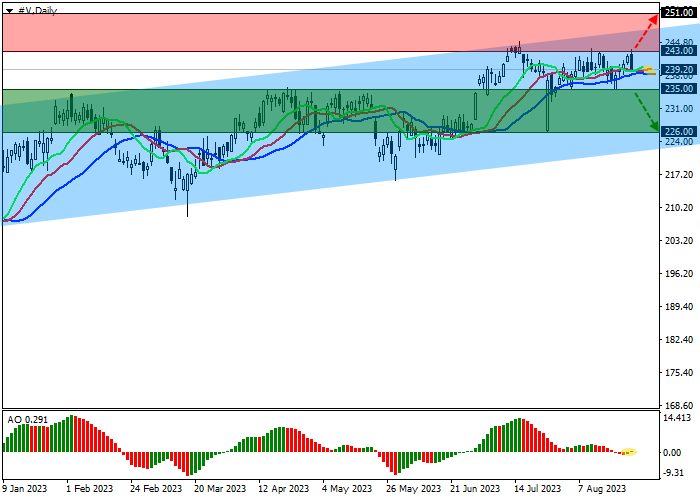
| Scenario | |
|---|---|
| Timeframe | Weekly |
| Recommendation | SELL STOP |
| Entry Point | 235.00 |
| Take Profit | 226.00 |
| Stop Loss | 238.00 |
| Key Levels | 222.00, 235.00, 239.00, 245.00, 248.00, 251.00 |
| Alternative scenario | |
|---|---|
| Recommendation | BUY STOP |
| Entry Point | 243.00 |
| Take Profit | 251.00 |
| Stop Loss | 237.00 |
| Key Levels | 222.00, 235.00, 239.00, 245.00, 248.00, 251.00 |
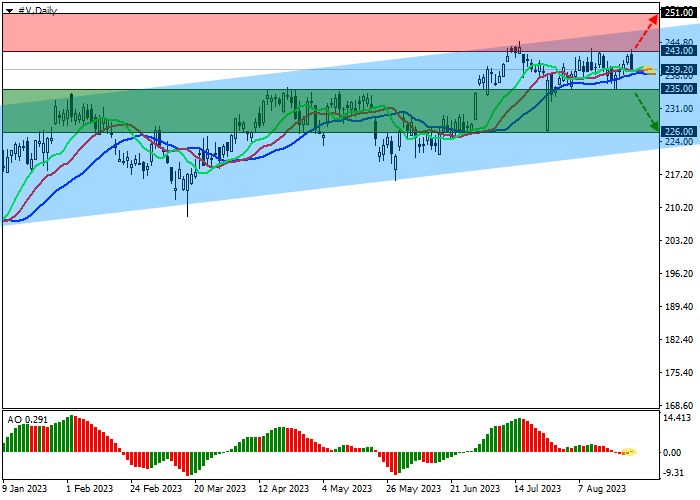
Shares of Visa Inc., the largest US multinational payment services company, are correcting at 239.00.
On the daily chart, the price is moving in a global uptrend within the corridor with dynamic boundaries of 248.00–222.00, reversing at the resistance line.
On the four-hour chart, the downside potential remains high, which is confirmed by the fact that the quotes are below the annual maximum of 245.00, however, if it is overcome, a change in trend is possible. The continuation of the negative dynamics to the low of last week around 235.00 and further, to support of the global channel at 222.00 looks most likely.
Technical indicators do not give a clear signal: the range of EMA fluctuations on the Alligator indicator is narrowed almost completely, and the AO oscillator histogram forms corrective bars near the transition level.
Trading tips
Short positions may be opened after a reversal, reduction, and consolidation of the price below 235.00 with the target at 226.00. Stop loss – 238.00. Implementation period: 7 days or more.
Long positions may be opened after the price rises and consolidates above 243.00 with the target at 251.00. Stop loss – 237.00.
风险提示:本文所述仅代表作者个人观点,不代表 Followme 的官方立场。Followme 不对内容的准确性、完整性或可靠性作出任何保证,对于基于该内容所采取的任何行为,不承担任何责任,除非另有书面明确说明。
 暂无评论。 来发表第一条观点吧。