


| Scenario | |
|---|---|
| Timeframe | Weekly |
| Recommendation | BUY STOP |
| Entry Point | 32200.5 |
| Take Profit | 33100.0 |
| Stop Loss | 31900.0 |
| Key Levels | 30600.0, 31600.0, 32200.0, 33100.0 |
| Alternative scenario | |
|---|---|
| Recommendation | SELL STOP |
| Entry Point | 31599.5 |
| Take Profit | 30600.0 |
| Stop Loss | 32000.0 |
| Key Levels | 30600.0, 31600.0, 32200.0, 33100.0 |
Current trend
The leading Japanese stock index NI 225 is correcting near the 32007.0 mark. The period of publication of corporate reports in Japan is almost over, and macroeconomic data and the situation on the domestic bond market are coming to the fore again.
Thus, the consumer price index in August rose from 2.5% to 2.6%, and the indicator in the Tokyo region decreased from 3.2% to 2.9%. A positive signal for the market was also the slowdown in core inflation in the Tokyo region from 3.0% to 2.8%, which may serve as a signal to reduce price growth across the country. The gradual decline in indicators strengthens the position of the Bank of Japan, which is in no hurry to abandon the policy of negative rates being implemented.
There is a downward correction in the bond market today: 10-year securities are trading at a rate of 0.655%, having lost 0.30%, the yield of 20-year bonds is 1.362%, having decreased by 1.73%, and of 30-year-old ones – 1.599%, having lost 4.05%.
The growth leaders in the index are Amada Co., Ltd. ( 5.72%), Dainippon Screen Mfg. Co., Ltd. ( 5.60%), Yaskawa Electric Corp. ( 4.27%), Daikin Industries, Ltd. ( 4.03%).
Among the leaders of the decline are J.Front Retailing Co., Ltd. (-4.31%), Takashimaya Co., Ltd. (-3.66%), Shiseido Co., Ltd. (-2.43%).
Support and resistance
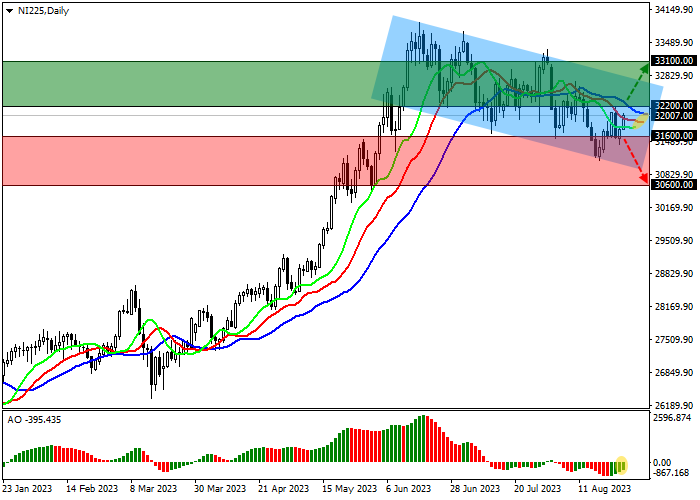
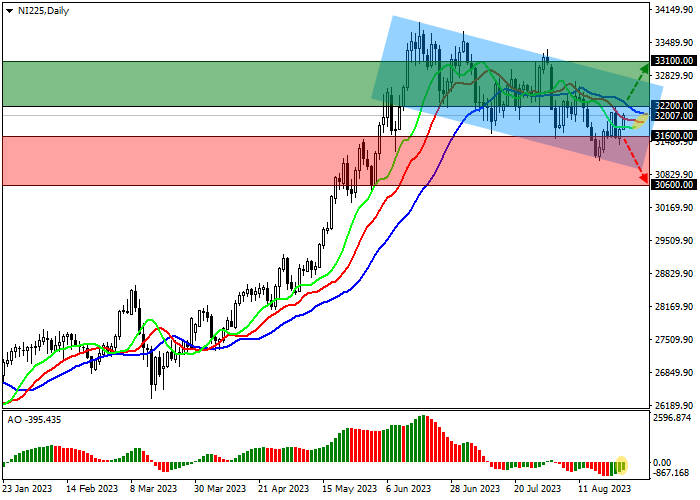
On the daily chart, the price is held within the local descending channel with dynamic boundaries of 32800.0–30800.0, rising in the direction of the resistance line.
Technical indicators are still in a state of uncertainty, reversing in the direction of possible growth: the AO histogram forms new correction bars, and the fast EMAs on the alligator indicator are approaching the signal line, narrowing the range of fluctuations.
Support levels: 31600.0, 30600.0.
Resistance levels: 32200.0, 33100.0.
Trading tips
If the asset continues growing and the price consolidates above the resistance level of 32200.0, long positions will be relevant with a target at 33100.0. Stop-loss – 31900.0. Implementation time: 7 days and more.
If the asset reverses and continues local decline and the price consolidates below 31600.0, short positions can be opened with a target at 30600.0. Stop-loss – 32000.0.
风险提示:本文所述仅代表作者个人观点,不代表 Followme 的官方立场。Followme 不对内容的准确性、完整性或可靠性作出任何保证,对于基于该内容所采取的任何行为,不承担任何责任,除非另有书面明确说明。
 暂无评论。 来发表第一条观点吧。