
| Scenario | |
|---|---|
| Timeframe | Intraday |
| Recommendation | BUY STOP |
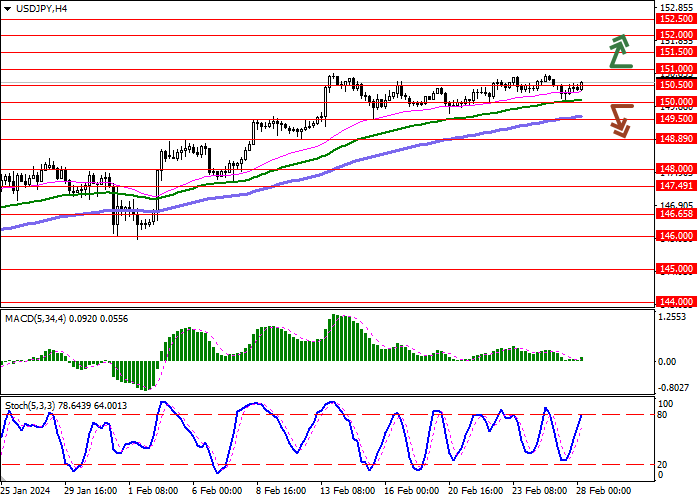
| Entry Point | 151.00 |
| Take Profit | 152.00 |
| Stop Loss | 150.50 |
| Key Levels | 148.00, 148.89, 149.50, 150.00, 150.50, 151.00, 151.50, 152.00 |
| Alternative scenario | |
|---|---|
| Recommendation | SELL STOP |
| Entry Point | 150.00 |
| Take Profit | 148.89 |
| Stop Loss | 150.50 |
| Key Levels | 148.00, 148.89, 149.50, 150.00, 150.50, 151.00, 151.50, 152.00 |
Current trend
During the Asian session, the USD/JPY pair is growing slightly, recovering from the renewal of the lows of February 22 and testing 150.60 for a breakout.
Today, investors are awaiting the publication of the key American statistics: according to preliminary estimates, the Q4 dynamics of gross domestic product (GDP) will accelerate, as before, by 3.3%, while the core index of personal consumption expenditures will remain at 2.0% QoQ. In addition, on Thursday, analysts expect a slowdown in the core price index from 2.9% to 2.8% YoY, while an increase from 0.2% to 0.4% MoM is expected.
Meanwhile, Japan’s January nationwide consumer price index is in at 2.2%, up from a forecast of 2.1% YoY, and the core indicator is 2.0%, beating estimates of 1.9%, increasing the possibility that the Bank of Japan will soon abandon its “dovish” policy. Most economists expect that in March, unions and company representatives to reach an agreement for significant wage increases, which would be a prerequisite for stimulus cuts to begin in March or April. On Thursday, January data on the dynamics of industrial production and retail sales will be published: analysts believe that trade dynamics will accelerate from 2.1% to 2.3% YoY, and production volumes will adjust by –7.3% compared to 1.4% previously.
Support and resistance
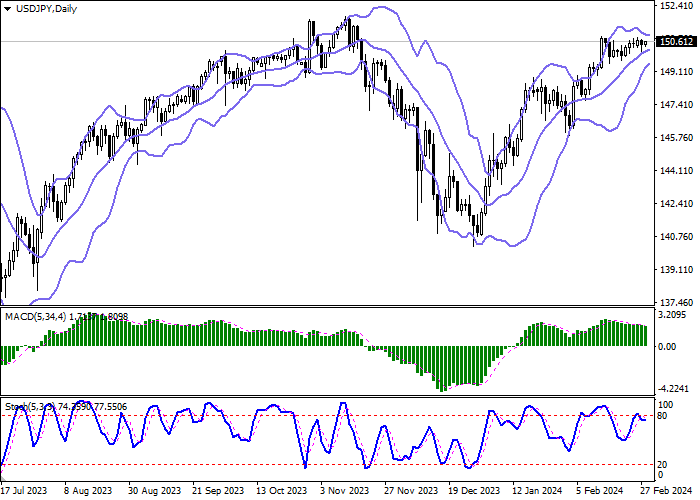
On the daily chart, Bollinger Bands try to reverse horizontally, keeping the “bullish” momentum. The MACD indicator declines, maintaining a poor sell signal (the histogram is below the signal line). Stochastic approached its highs and tends to reverse flat, indicating an approximate balance of forces in the ultra-short term.
Resistance levels: 150.50, 151.00, 151.50, 152.00.
Support levels: 150.00, 149.50, 148.89, 148.00.
Trading tips
Long positions may be opened after a breakout of 151.00, with the target at 152.00. Stop loss – 150.50. Implementation time: 2–3 days.
Short positions may be opened after a decline and breakdown of 150.00, with the target at 148.89. Stop loss – 150.50.
风险提示:本文所述仅代表作者个人观点,不代表 Followme 的官方立场。Followme 不对内容的准确性、完整性或可靠性作出任何保证,对于基于该内容所采取的任何行为,不承担任何责任,除非另有书面明确说明。

暂无评论,立马抢沙发