
| Scenario | |
|---|---|
| Timeframe | Weekly |
| Recommendation | SELL STOP |
| Entry Point | 25.75 |
| Take Profit | 24.22, 23.44 |
| Stop Loss | 27.50 |
| Key Levels | 23.44, 24.22, 25.78, 28.12, 29.69, 31.25 |
| Alternative scenario | |
|---|---|
| Recommendation | BUY STOP |
| Entry Point | 28.15 |
| Take Profit | 29.69, 31.25 |
| Stop Loss | 27.10 |
| Key Levels | 23.44, 24.22, 25.78, 28.12, 29.69, 31.25 |
Current trend
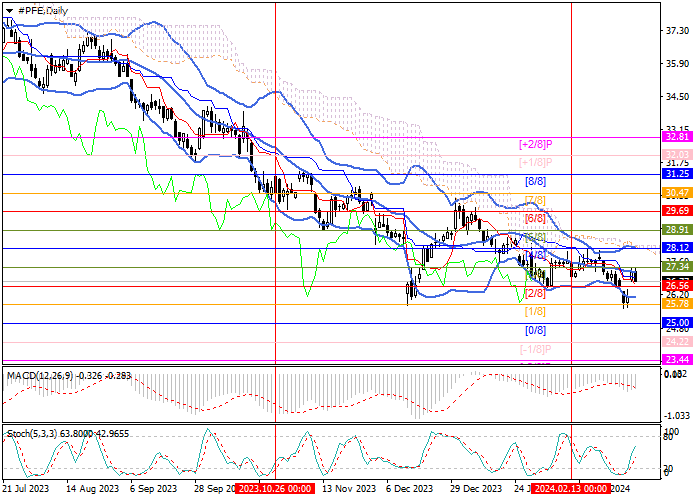
Shares of Pfizer Inc., the largest American pharmaceutical company, are moving as part of a long-term downward trend. This week, the quotes tested 25.78 (Murrey level [1/8]) but could not break below and corrected to the lower border of the central Murrey channel of 27.34 (Murrey level [3/8]), supported by the middle line of Bollinger bands. To develop growth and change the downward trend, the quotes need to consolidate above the central mark of the trading range 28.12 (Murrey level [4/8]), and then the positive dynamics can continue to the area of 29.69 (Murrey level [6/8]) and 31.25 (level Murrey [8/8]). A breakdown of the key “bearish” level of 25.78 will allow the asset to reach the lower reversal zone of 24.22 (Murrey level [–1/8]) and 23.44 (Murrey level [–2/8]).
Technical indicators reflect a continuation of the downward trend: Bollinger bands are directed downwards, and the MACD histogram is decreasing, remaining in the negative zone. However, Stochastic upward reversal does not exclude limited corrective growth.
Support and resistance
Resistance levels: 28.12, 29.69, 31.25.
Support levels: 25.78, 24.22, 23.44.
Trading tips
Short positions may be opened below 25.78 with the targets at 24.22, 23.44 and stop loss 27.50. Implementation time: 5–7 days.
Long positions may be opened above 28.12 with the targets at 29.69, 31.25 and stop loss 27.10.
风险提示:本文所述仅代表作者个人观点,不代表 Followme 的官方立场。Followme 不对内容的准确性、完整性或可靠性作出任何保证,对于基于该内容所采取的任何行为,不承担任何责任,除非另有书面明确说明。

暂无评论,立马抢沙发