


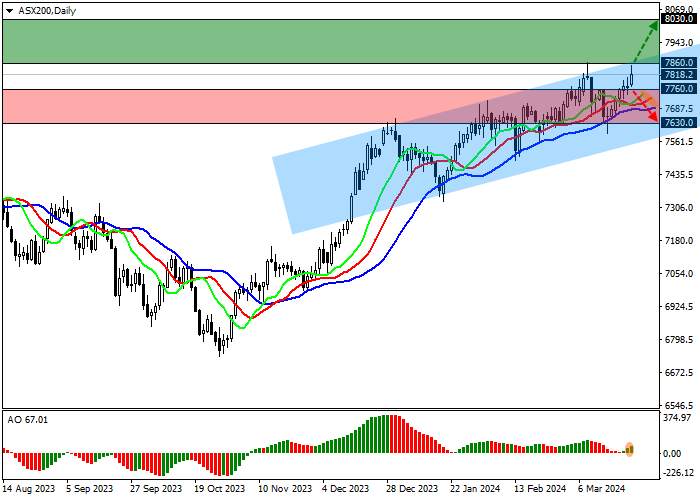
| Scenario | |
|---|---|
| Timeframe | Weekly |
| Recommendation | BUY STOP |
| Entry Point | 7860.0 |
| Take Profit | 8030.0 |
| Stop Loss | 7800.0 |
| Key Levels | 7630.0, 7760.0, 7860.0, 8030.0 |
| Alternative scenario | |
|---|---|
| Recommendation | SELL STOP |
| Entry Point | 7760.0 |
| Take Profit | 7630.0 |
| Stop Loss | 7820.0 |
| Key Levels | 7630.0, 7760.0, 7860.0, 8030.0 |
Current trend
The leading index of the Australian economy, the ASX 200, shows corrective dynamics near the 7818.0 mark. The corporate reporting season starts at the end of April, and so far investors are focused on macroeconomic statistics and the situation on the domestic bond market.
On Friday, labor force survey data was presented in Australia, which reflected a decrease in the seasonally adjusted unemployment rate by 0.4% to 3.7% in February. Against the background of employment growth, the seasonally adjusted employment-to-population ratio increased by 0.4% to 64.2%, and the level of economic activity of the population increased by 0.1% to 66.7%.
The domestic bond market is currently experiencing a local downward correction: 10-year securities are trading at a rate of 4.024%, down from 4.187% recorded last week, the yield of 20-year bonds is 4.405%, below the previous indicator of 4.534%, and the rate on 30-year securities dropped to 4.392% from 4.546%.
The growth leaders in the index are Appen Ltd. ( 10.71%), Megaport Ltd. ( 4.00%), Goodman Group ( 3.93%), Elders Ltd. ( 3.68%).
Among the leaders of the decline are ALS Ltd. (-4.84%), St Barbara Ltd. (-4.29%), NRW Holdings (-3.24%), Star Entertainment Group Ltd. (-2.78%).
Support and resistance
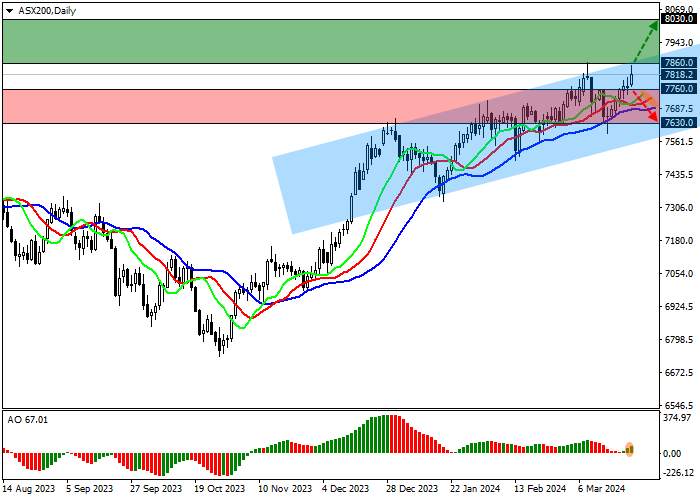
On the D1 chart, the price is holding near the annual maximum of 7820.0, preparing for a new attempt to test it and waiting for the continued decline in bond yields.
Technical indicators maintain a fairly stable buy signal: the fast EMAs of the Alligator indicator remain above the signal line, keeping the oscillation range stable, and the AO histogram forms corrective bars while being in the buy zone.
Support levels: 7760.0, 7630.0.
Resistance levels: 7860.0, 8030.0.
Trading tips
In case of continued growth of the asset, as well as price consolidation above the resistance level of 7860.0, buy positions with the target of 8030.0 and stop-loss of 7800.0 can be opened. Implementation time: 7 days and more.
In the event of a reversal and continued decline of the asset after consolidation below the 7760.0 mark, sell positions with the target of 7630.0 may be opened. Stop-loss – 7820.0.
风险提示:本文所述仅代表作者个人观点,不代表 Followme 的官方立场。Followme 不对内容的准确性、完整性或可靠性作出任何保证,对于基于该内容所采取的任何行为,不承担任何责任,除非另有书面明确说明。

暂无评论,立马抢沙发