


| Scenario | |
|---|---|
| Timeframe | Intraday |
| Recommendation | SELL STOP |
| Entry Point | 0.9035 |
| Take Profit | 0.8964 |
| Stop Loss | 0.9071 |
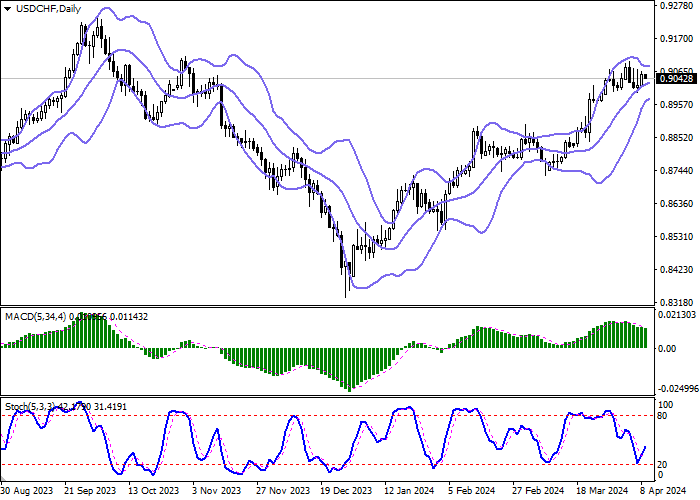
| Key Levels | 0.8935, 0.8964, 0.9000, 0.9037, 0.9071, 0.9100, 0.9130, 0.9150 |
| Alternative scenario | |
|---|---|
| Recommendation | BUY STOP |
| Entry Point | 0.9075 |
| Take Profit | 0.9130 |
| Stop Loss | 0.9037 |
| Key Levels | 0.8935, 0.8964, 0.9000, 0.9037, 0.9071, 0.9100, 0.9130, 0.9150 |
Current trend
During the Asian session, the USD/CHF pair decreased slightly, consolidating near 0.9040: yesterday, the American dollar was actively growing, but now trading participants are in no hurry to open new positions, waiting for new drivers for the movement of the instrument to emerge.
The quotes continue to be supported by strong labor market data published at the end of last week: in March, nonfarm payrolls increased from 270.0K to 303.0K compared to forecasts of 200.0K, the unemployment rate adjusted from 3.9% to 3.8%, the average hourly wage – from 0.2% to 0.3% MoM and from 4.3% to 4.1% YoY. Statistics confirm the current doubts regarding the US Fed interest rate cut during the June meeting: more and more analysts believe that the launch of the monetary easing program will be delayed until the end of 2024. In this regard, the head of the Federal Reserve Bank (FRB) of Dallas, Laurie Logan, said that the danger of stabilizing inflation above the target level remains, and, therefore, a sharp transition to the “dovish” rhetoric is impossible. A similar opinion was expressed by US Fed Board member Michelle Bowman, noting that due to the continued risks of a new acceleration in consumer price growth, it is premature to begin reducing borrowing costs.
In turn, macroeconomic statistics from Switzerland exerted some pressure on the franc: in March, the unemployment rate increased from 2.2% to 2.3%, which, however, remains low for the region.
Support and resistance
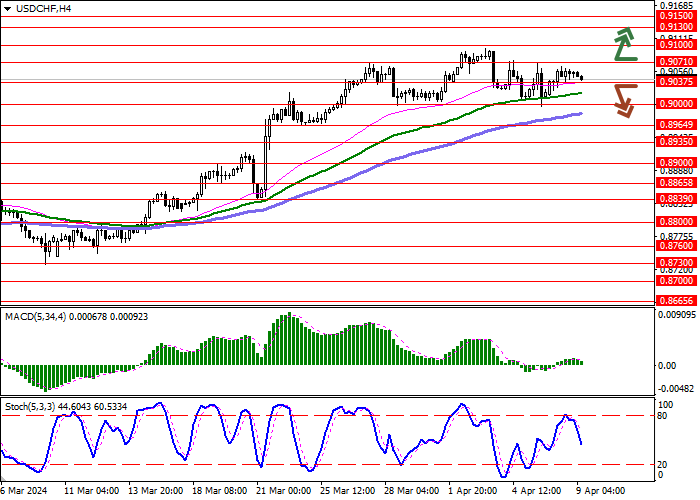
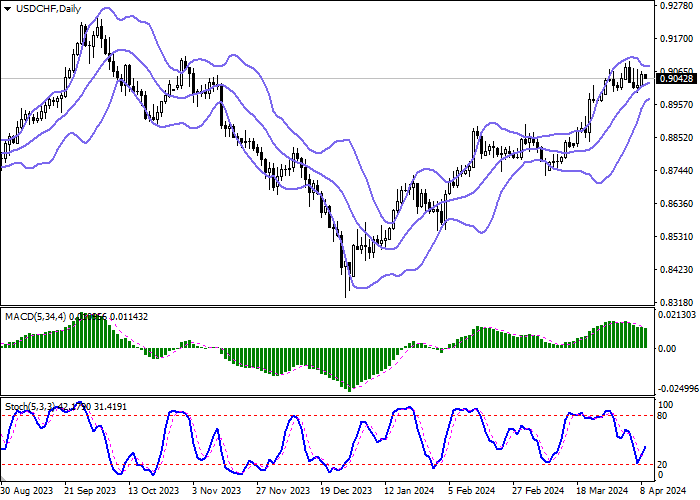
On the daily chart, Bollinger Bands are trying to reverse horizontally: the price range changes slightly, remaining wide enough for the market activity. The MACD indicator is declining, maintaining a sell signal: the histogram is below the signal line. Stochastic retreated from the “20” mark, reversed upwards, and is signaling in favor of the development of the “bullish” dynamics soon.
Resistance levels: 0.9071, 0.9100, 0.9130, 0.9150.
Support levels: 0.9037, 0.9000, 0.8964, 0.8935.
Trading tips
Short positions may be opened after a breakdown of 0.9037, with the target at 0.8964. Stop loss – 0.9071. Implementation time: 1–2 days.
Long positions may be opened after a breakout of 0.9071, with the target at 0.9130. Stop loss – 0.9037.
风险提示:本文所述仅代表作者个人观点,不代表 Followme 的官方立场。Followme 不对内容的准确性、完整性或可靠性作出任何保证,对于基于该内容所采取的任何行为,不承担任何责任,除非另有书面明确说明。
 暂无评论。 来发表第一条观点吧。