


| Scenario | |
|---|---|
| Timeframe | Intraday |
| Recommendation | BUY STOP |
| Entry Point | 5210.0 |
| Take Profit | 5234.4 |
| Stop Loss | 5200.0 |
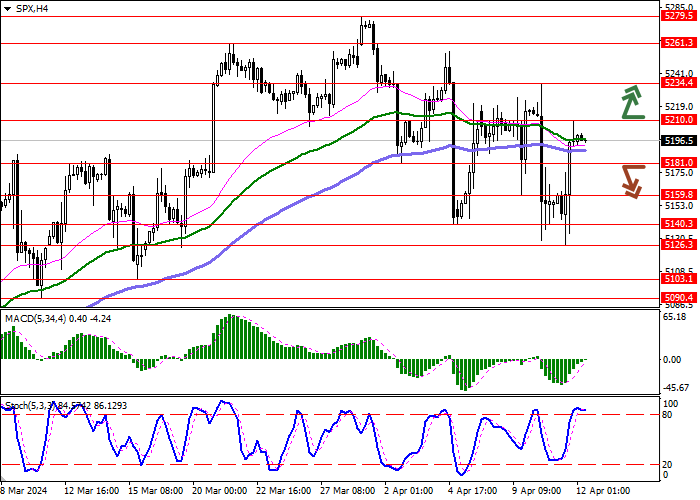
| Key Levels | 5126.3, 5140.3, 5159.8, 5181.0, 5210.0, 5234.4, 5261.3, 5279.5 |
| Alternative scenario | |
|---|---|
| Recommendation | SELL STOP |
| Entry Point | 5181.0 |
| Take Profit | 5140.3 |
| Stop Loss | 5200.0 |
| Key Levels | 5126.3, 5140.3, 5159.8, 5181.0, 5210.0, 5234.4, 5261.3, 5279.5 |
Current trend
During the Asian session, the leading index of the American economy, the S&P 500, shows near-zero dynamics, remaining close to 5200.0. Market activity is reduced due to the lack of key macroeconomic statistics at the end of the week.
Among American publications, the Consumer Confidence Index from the University of Michigan may be of interest: forecasts suggest that in April the indicator will decrease from 79.4 points to 79.0 points. In addition, investors will pay attention to the comments of the President of the Federal Reserve Bank (FRB) of Atlanta, Raphael Bostic.
Trading participants continue to analyze inflation statistics published yesterday: in March, the Producer Price Index accelerated from 1.6% to 2.1% in annual terms, but slowed down from 0.6% to 0.2% in monthly terms. The Core PPI, excluding the most volatile food commodities and energy, adjusted from 2.1% to 2.4% and from 0.3% to 0.2% in annual and monthly terms, respectively, increasing the likelihood of the US Federal Reserve maintaining high interest rates. According to the Chicago Mercantile Exchange (CME Group) FedWatch Tool, most market participants expect two cuts in borrowing costs during the year, with the first of them not likely to occur until September, and some experts believe that monetary policy adjustments this year may not occur at all. In addition, for the week ended April 5, Initial Jobless Claims decreased from 222.0 thousand to 211.0 thousand, below market expectations of 215.0 thousand, and Continuing Jobless Claims increased to 1.817 million, exceeding the expected 1.800 million.
Support and resistance
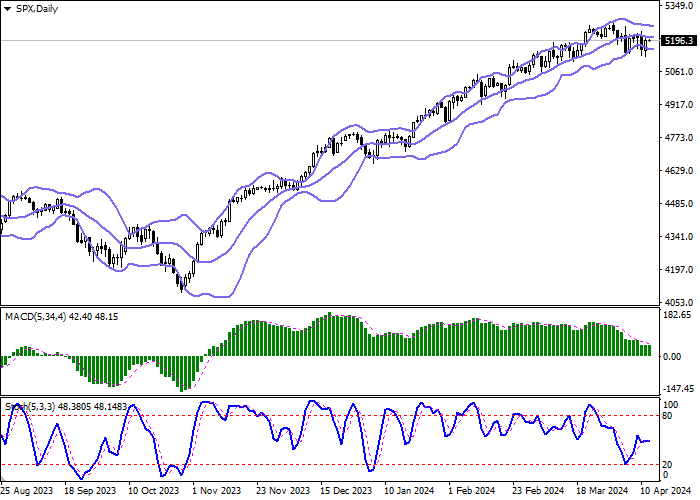
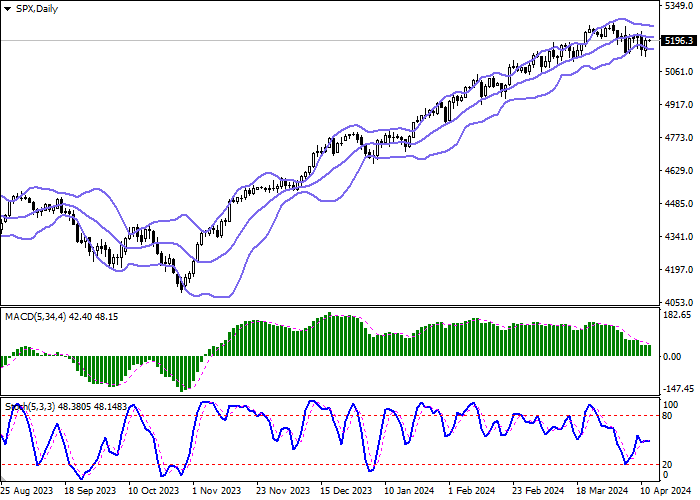
On the daily chart, Bollinger Bands are moving in a flat: the price range changes slightly, remaining quite spacious for the level of activity in the market. MACD is declining, maintaining a weak sell signal: the histogram is located below the signal line. Stochastic reversed horizontally in the center of its area, indicating the balance of sentiment in the ultra-short term: one should wait for the signals from the technical indicator to be clarified.
Resistance levels: 5210.0, 5234.4, 5261.3, 5279.5.
Support levels: 5181.0, 5159.8, 5140.3, 5126.3.
Trading tips
Long positions can be opened after breakout of 5210.0 with the target of 5234.4. Stop-loss – 5200.0. Implementation time: 1-2 days.
Short positions can be opened after a breakdown of the level 5181.0 downwards with a target of 5140.3. Stop-loss — 5200.0.
风险提示:本文所述仅代表作者个人观点,不代表 Followme 的官方立场。Followme 不对内容的准确性、完整性或可靠性作出任何保证,对于基于该内容所采取的任何行为,不承担任何责任,除非另有书面明确说明。
 暂无评论。 来发表第一条观点吧。