


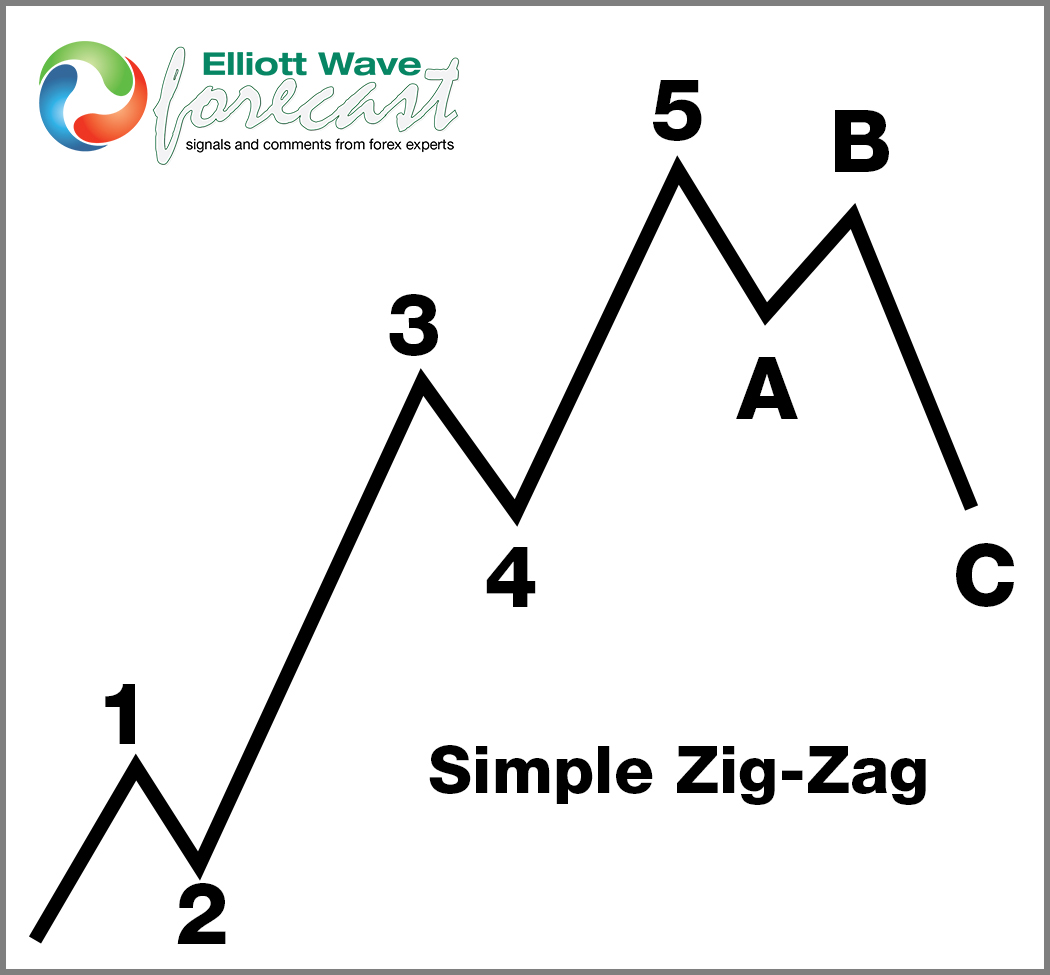
Hello everyone. In today’s article, we will look at the past performance of the 1H Hour Elliott Wave chart of SPDR Metals & Mining ETF ($XME). The rally from 3.14.2024 low at $55.37 unfolded as 5 waves impulse. So, we expected the pullback to unfold in 3 swings and find buyers again. We will explain the structure & forecast below:
5 Wave Impulse Structure + ABC correction
$XME 1H Elliott Wave Chart 4.15.2024:
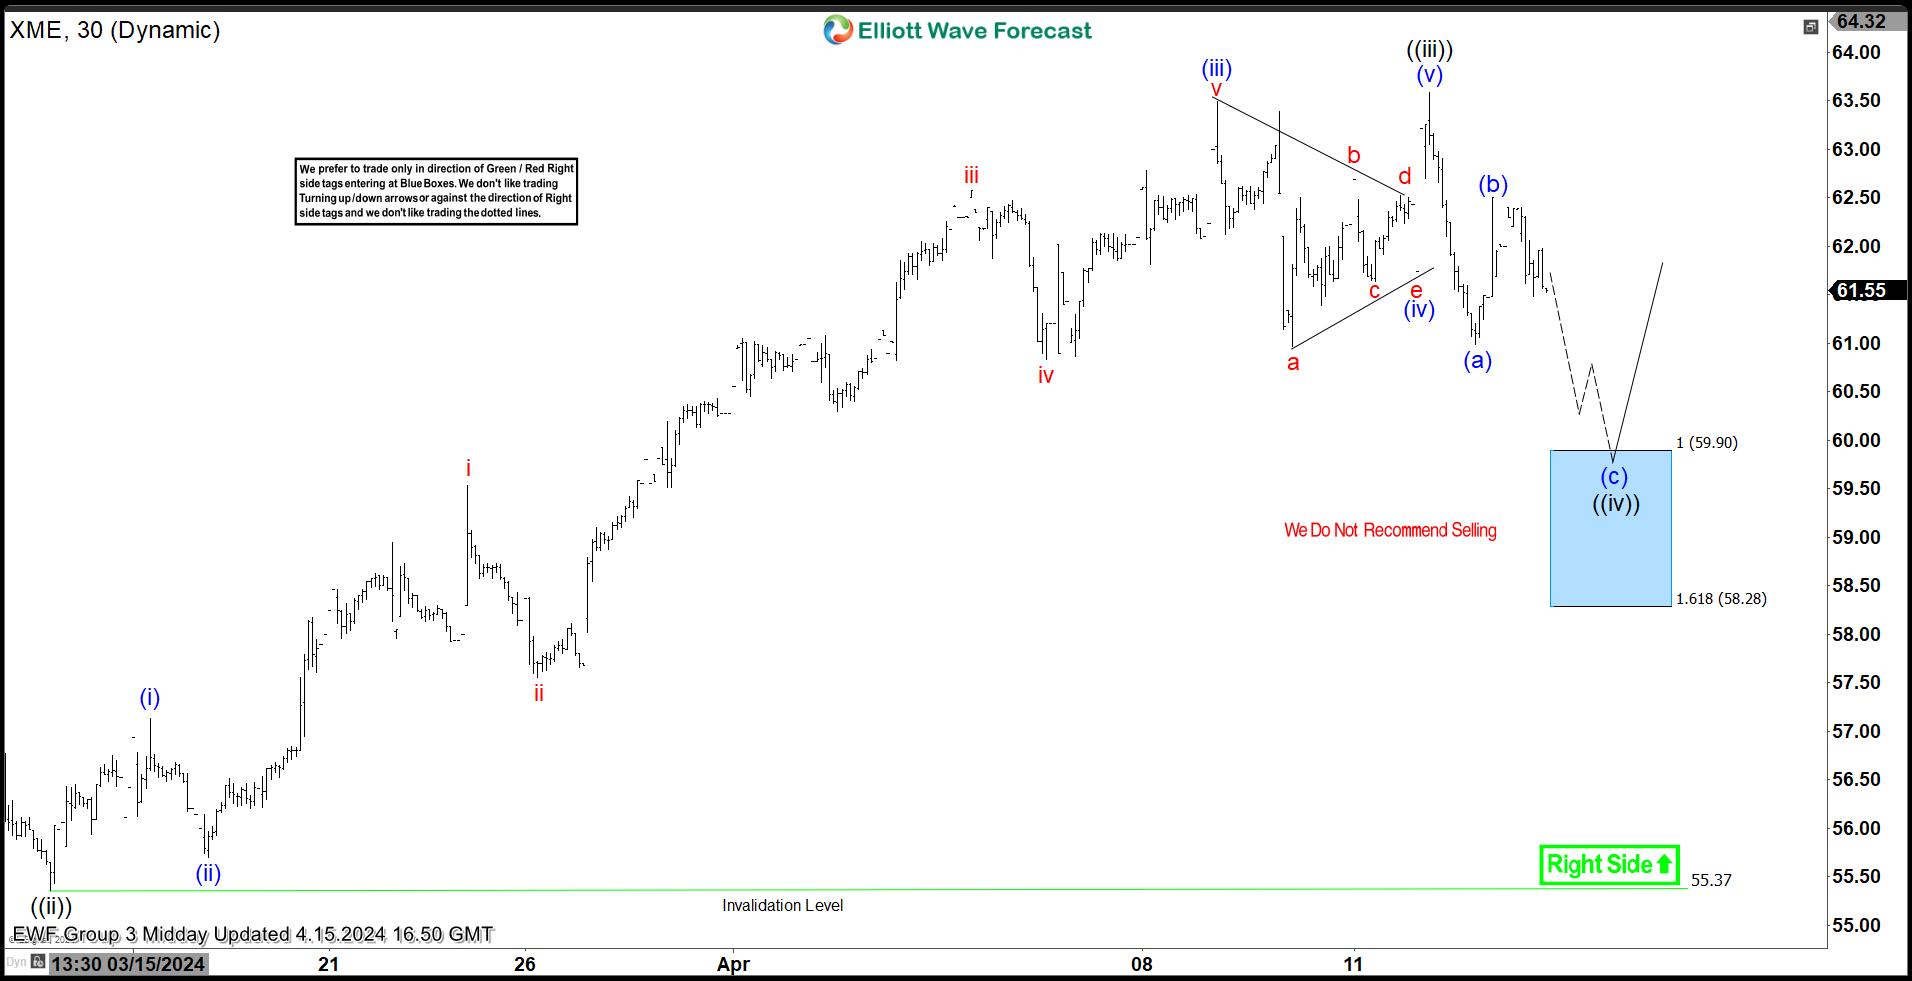 Here is the 1H Elliott Wave count from 4.15.2024. We expected the pullback to find buyers at the blue box area at 59.90 – 58.28 in 3 swings.
$XME 1H Elliott Wave Chart 4.17.2024:
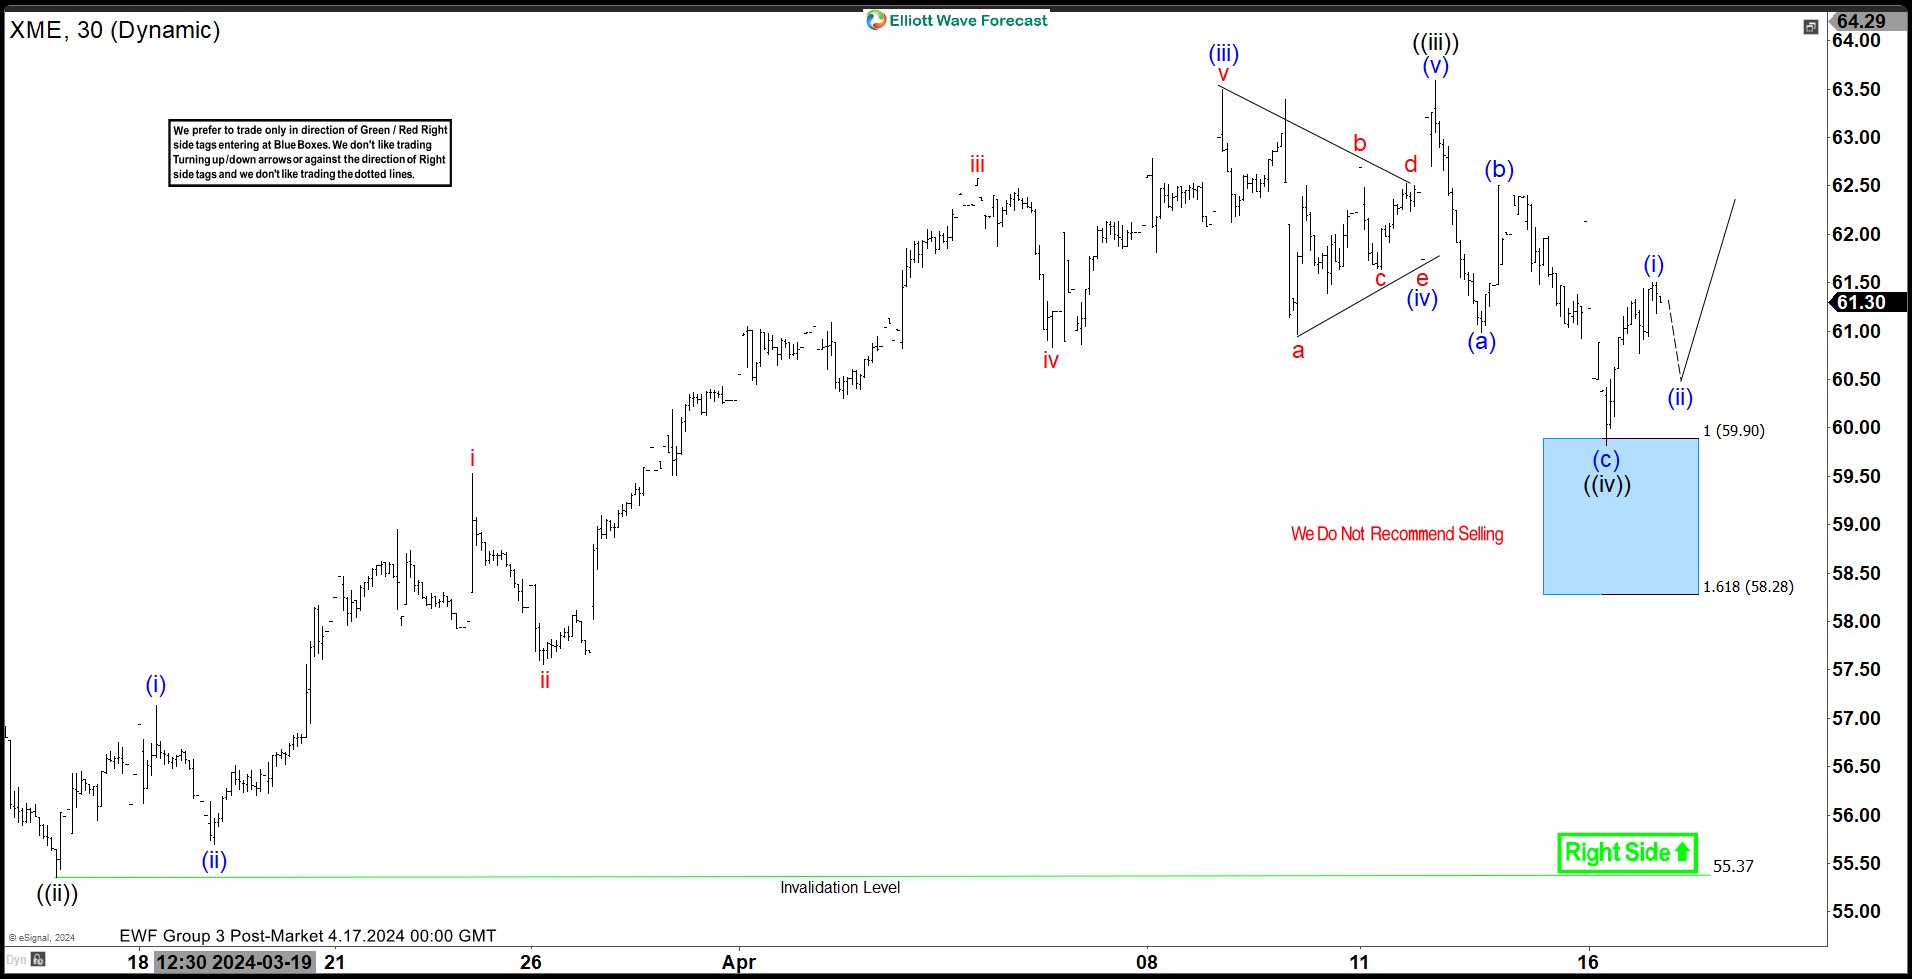 Here is the 1H update from 4.17.2024 showing the bounce taking place as expected. The ETF has reacted higher from the blue box area allowing longs to get risk free before the next leg takes place.
风险提示:本文所述仅代表作者个人观点,不代表 Followme 的官方立场。Followme 不对内容的准确性、完整性或可靠性作出任何保证,对于基于该内容所采取的任何行为,不承担任何责任,除非另有书面明确说明。
 暂无评论。 来发表第一条观点吧。