


| Scenario | |
|---|---|
| Timeframe | Weekly |
| Recommendation | SELL STOP |
| Entry Point | 468.70 |
| Take Profit | 437.50, 375.00 |
| Stop Loss | 490.00 |
| Key Levels | 375.00, 437.50, 468.75, 500.00, 531.25, 562.50 |
| Alternative scenario | |
|---|---|
| Recommendation | SELL LIMIT |
| Entry Point | 531.25 |
| Take Profit | 437.50, 375.00 |
| Stop Loss | 550.00 |
| Key Levels | 375.00, 437.50, 468.75, 500.00, 531.25, 562.50 |
Current trend
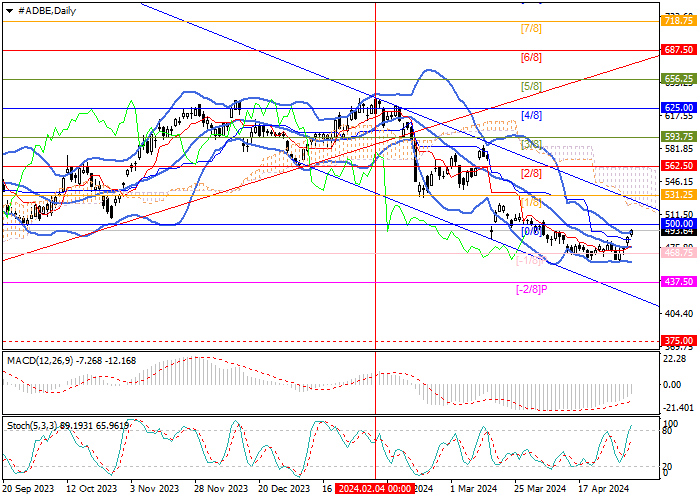
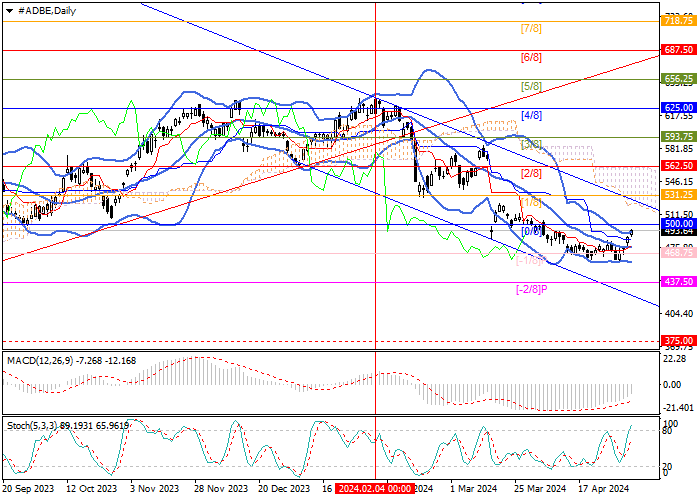
Shares of Adobe Inc., a leading American software developer, have been declining for the fourth month in a row, adjusting to a long-term uptrend: during this time, the price reversed from the central mark of the Murrey trading range of 625.00 (Murrey level [4/8]), entered the lower reversal zone and reached the level of 468.75 (Murrey level [-1/8]) which it couldn't break through.
Currently, the quotes have resumed growth. With a breakout of the 500.00 mark (Murrey level [0/8]), the price will return to the main trading range and will be able to reach the levels of 531.25 (Murrey level [1/8]), 562.50 (Murrey level [2/8]). The key for the "bears" remains the 468.75 mark (Murrey level [-1/8]), consolidating the price below which will lead to a resumption of the decline to 437.50 (Murrey level [-2/8]) and 375.00 (Murrey level [2/8], W1).
Technical indicators do not give a clear signal: Bollinger Bands are pointing down, MACD is decreasing in the negative zone, while Stochastic is directed up, but it is approaching the overbought zone, which does not exclude an early downward reversal.
Support and resistance
Resistance levels: 500.00, 531.25, 562.50.
Support levels: 468.75, 437.50, 375.00.
Trading tips
Short positions can be opened below the 468.75 mark or after a price reversal at 531.25 with targets of 437.50, 375.00 and stop-losses of 490.00 and 550.00, respectively. Implementation period: 5–7 days.
风险提示:本文所述仅代表作者个人观点,不代表 Followme 的官方立场。Followme 不对内容的准确性、完整性或可靠性作出任何保证,对于基于该内容所采取的任何行为,不承担任何责任,除非另有书面明确说明。
 暂无评论。 来发表第一条观点吧。