


| Scenario | |
|---|---|
| Timeframe | Intraday |
| Recommendation | SELL STOP |
| Entry Point | 34.7086 |
| Take Profit | 34.6092 |
| Stop Loss | 34.3603 |
| Key Levels | 34.3603,34.6092,34.3604,34.<wbr>6093 |
| Alternative scenario | |
|---|---|
| Recommendation | BUY STOP |
| Entry Point | 34.7844 |
| Take Profit | 34.7851 |
| Stop Loss | 34.7351 |
| Key Levels | 34.7851,34.7351,34.7852,34.<wbr>7352 |
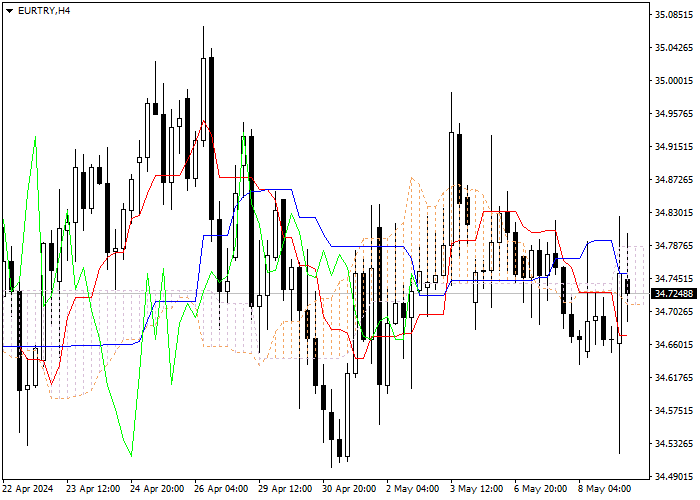
Let's look at the four-hour chart. Tenkan-sen line is below Kijun-sen, the lines are horizontal . Confirmative line Chikou Span is crossing the price chart from above, current cloud is descending. The instrument has entered the cloud. One of the previous minimums of Chikou Span line is expected to be a support level (34.6213). The closest resistance level is the lower border of the cloud (34.7744).
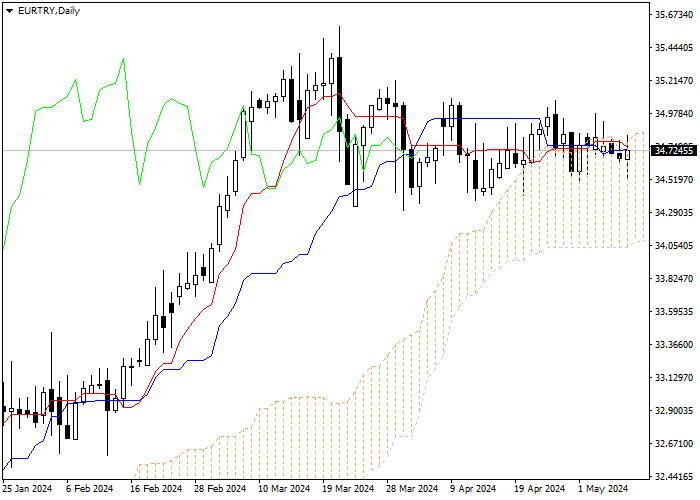
On the daily chart Tenkan-sen line is above Kijun-sen, the red line is directed downwards, while the blue one remains horizontal. Confirmative line Chikou Span is crossing the price chart from below, current cloud is ascending. The instrument has entered the cloud. One of the previous minimums of Chikou Span line is expected to be a support level (34.6214). The closest resistance level is the lower border of the cloud (34.7745).
On the four-hour chart the instrument is trading within the cloud. On the daily chart the instrument is trading within the cloud. It is not recommended to open positions at current price. Pending orders should be placed at the cloud’s borders: sell at the level of 34.7086, with Take Profit at 34.6092 and Stop Loss at 34.3603; buy at the level of 34.7844, with Take Profit at 34.7851 and Stop Loss at 34.7351.
风险提示:本文所述仅代表作者个人观点,不代表 Followme 的官方立场。Followme 不对内容的准确性、完整性或可靠性作出任何保证,对于基于该内容所采取的任何行为,不承担任何责任,除非另有书面明确说明。
 暂无评论。 来发表第一条观点吧。