


| Scenario | |
|---|---|
| Timeframe | Weekly |
| Recommendation | SELL STOP |
| Entry Point | 132.00 |
| Take Profit | 123.00 |
| Stop Loss | 136.00 |
| Key Levels | 123.00, 129.00, 130.00, 132.00, 134.00, 136.00, 146.00, 152.00, 154.00 |
| Alternative scenario | |
|---|---|
| Recommendation | BUY STOP |
| Entry Point | 137.00 |
| Take Profit | 146.00 |
| Stop Loss | 132.00 |
| Key Levels | 123.00, 129.00, 130.00, 132.00, 134.00, 136.00, 146.00, 152.00, 154.00 |
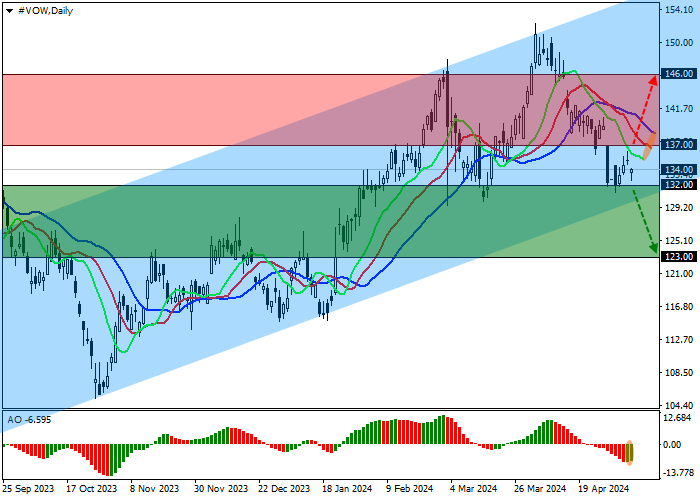
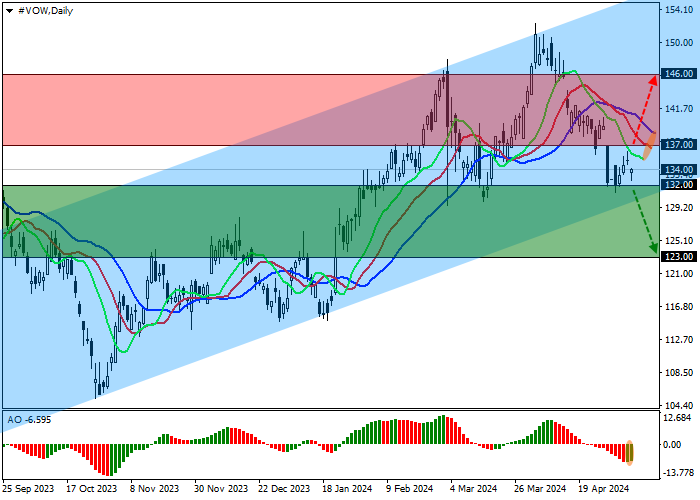
Shares of Volkswagen AG, a German automobile corporation, are actively adding value, holding just below 134.00.
On the daily chart, the instrument is trading within an ascending channel with dynamic boundaries of 154.00–130.00, trying to overcome the support line.
On a four-hour chart, after reaching the support line around 132.00, the price is preparing to leave the channel, and if successful, the first target will be at the low of 129.00. However, the possibility of a reflection from the line and the quotes going up cannot be ruled out, so the price needs to consolidate above the current high of 137.00, which will allow it to once again reach the annual peak levels around 152.00.
Technical indicators have already reversed and are giving a stable sell signal: fast EMAs of the Alligator indicator move away from the signal line and continue to expand the range of fluctuations, and the AO histogram, being in the sales zone, forms new corrective bars and remains below the transition level.
Trading tips
Short positions can be opened after the price consolidates below the local support level of 132.00 with the target of 123.00. Stop-loss — 136.00. Implementation time: 7 days and more.
Long positions can be opened after the price consolidates above the resistance level of 137.00 with the target at 146.00 and stop-loss at 132.00.
风险提示:本文所述仅代表作者个人观点,不代表 Followme 的官方立场。Followme 不对内容的准确性、完整性或可靠性作出任何保证,对于基于该内容所采取的任何行为,不承担任何责任,除非另有书面明确说明。
 暂无评论。 来发表第一条观点吧。