


· 阅读量 117
风险提示:本文所述仅代表作者个人观点,不代表 Followme 的官方立场。Followme 不对内容的准确性、完整性或可靠性作出任何保证,对于基于该内容所采取的任何行为,不承担任何责任,除非另有书面明确说明。
喜欢的话,赞赏支持一下
| Scenario | |
|---|---|
| Timeframe | Weekly |
| Recommendation | SELL |
| Entry Point | 76.55 |
| Take Profit | 60.00, 50.00 |
| Stop Loss | 84.60 |
| Key Levels | 50.00, 60.00, 84.60, 103.00, 121.18 |
| Alternative scenario | |
|---|---|
| Recommendation | BUY STOP |
| Entry Point | 84.65 |
| Take Profit | 50.00 |
| Stop Loss | 103.00, 121.18 |
| Key Levels | 50.00, 60.00, 84.60, 103.00, 121.18 |
The probability of decline remains.
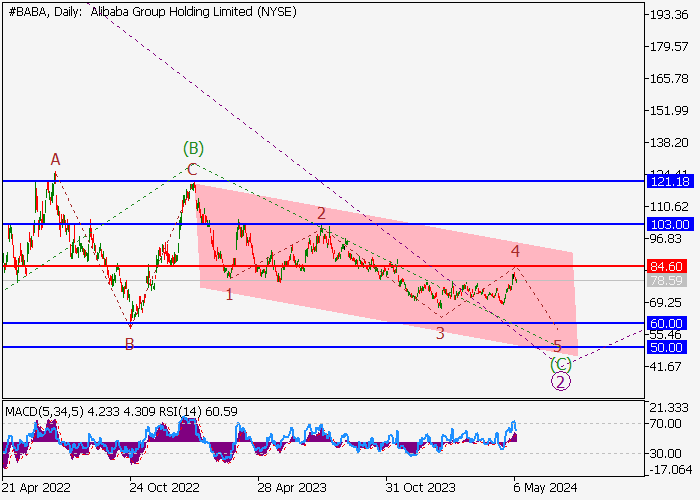
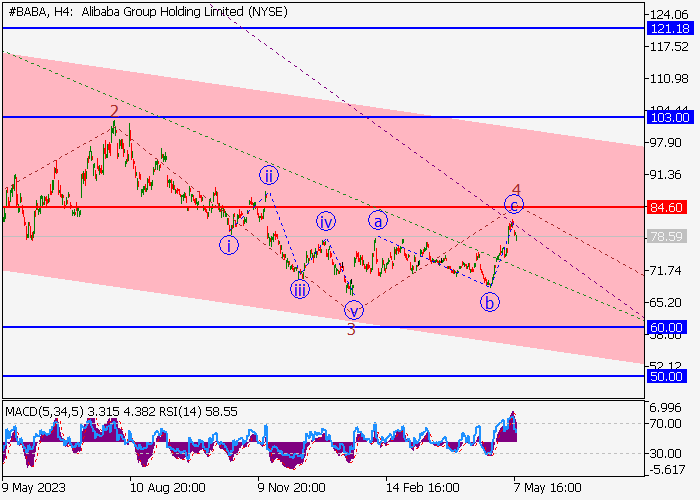
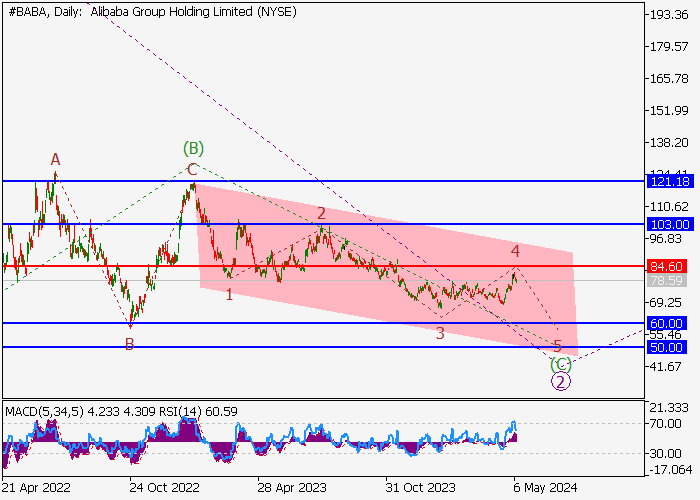
On the daily chart, the construction of a downward correction of the higher level continues as wave 2, which includes wave (C) of 2. At the moment, the third wave 3 of (C) and the local correction as the fourth wave 4 of (C) have ended. If the assumption is correct, the asset will decrease to the area of 60.00–50.00. The level of 84.60 is critical and stop-loss for this scenario.
Main scenario
Short positions are relevant below the level of 84.60 with targets at 60.00–50.00. Implementation time: 7 days and more.
Alternative scenario
Breakout and consolidation of the price above 84.60 will allow the instrument to continue its uptrend to the area of 103.00–121.18.
风险提示:本文所述仅代表作者个人观点,不代表 Followme 的官方立场。Followme 不对内容的准确性、完整性或可靠性作出任何保证,对于基于该内容所采取的任何行为,不承担任何责任,除非另有书面明确说明。
 暂无评论。 来发表第一条观点吧。