


| Scenario | |
|---|---|
| Timeframe | Weekly |
| Recommendation | BUY STOP |
| Entry Point | 162.70 |
| Take Profit | 165.85, 168.37 |
| Stop Loss | 161.14 |
| Key Levels | 151.83, 154.71, 158.42, 162.69, 165.85, 168.37 |
| Alternative scenario | |
|---|---|
| Recommendation | SELL STOP |
| Entry Point | 158.40 |
| Take Profit | 154.71, 151.83 |
| Stop Loss | 159.92 |
| Key Levels | 151.83, 154.71, 158.42, 162.69, 165.85, 168.37 |
USD/JPY, H4
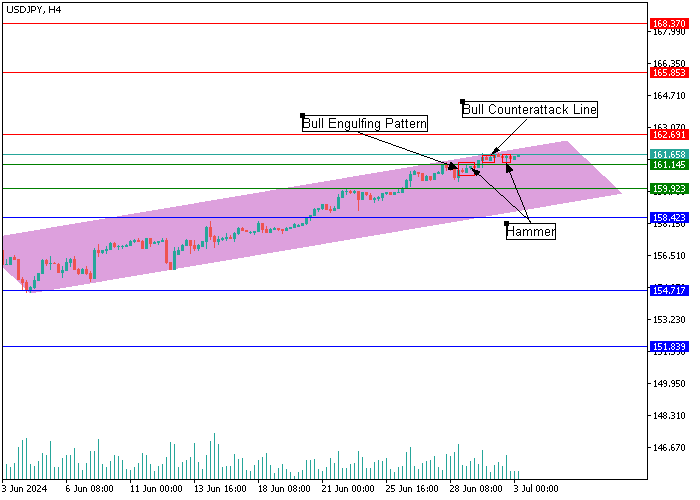
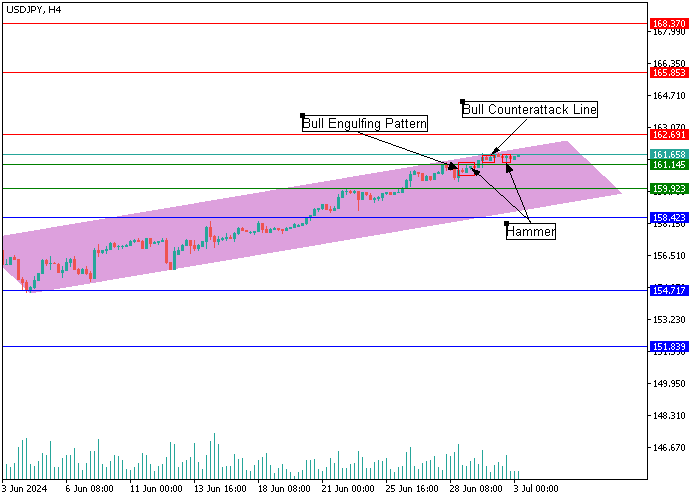
On the four-hour chart, the USD/JPY pair is moving within an uptrend, renewing local highs and holding at 161.65 during morning trading. Around 161.14, the Bull Engulfing Pattern, Bull Counterattack Line, and Hammer candlestick patterns formed, signaling continued pressure on the price from buyers, who will most likely attempt to consolidate the price above the resistance level of 162.69 soon, which will serve as a driver for movement to 165.85–168.37. After decline and reversal, it may reach 158.42 and the area of 154.71–151.83.
USD/JPY, D1
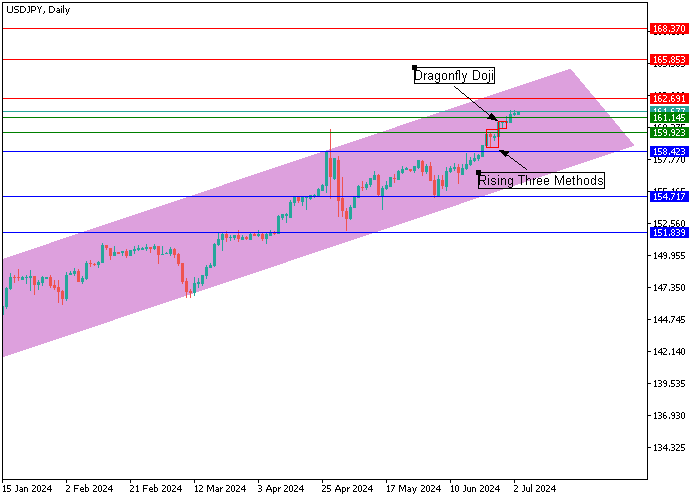
On the daily chart, the upward trend continuation pattern Rising Three Methods is forming at 158.42, and the candlestick analysis Dragonfly Doji is developing above 159.92, confirming the continued uncertainty in the market and the presence of the “bullish” potential. However, at the tops, the Dragonfly Doji pattern can signal a trend reversal, but additional signals are needed. Most likely, the asset will grow to the resistance level of 162.69 and after breakout – to the area of 165.85–168.37.
Support and resistance
Resistance levels: 162.69, 165.85, 168.37.
Support levels: 158.42, 154.71, 151.83.
Trading tips
Long positions may be opened above 162.69, with the targets at 165.85, 168.37. Stop loss — 161.14. Implementation period: 7 days or more.
Short positions may be opened below 158.42, with the targets at 154.71, 151.83. Stop loss — 159.92.
风险提示:本文所述仅代表作者个人观点,不代表 Followme 的官方立场。Followme 不对内容的准确性、完整性或可靠性作出任何保证,对于基于该内容所采取的任何行为,不承担任何责任,除非另有书面明确说明。
 暂无评论。 来发表第一条观点吧。