| Scenario | |
|---|---|
| Timeframe | Weekly |
| Recommendation | SELL STOP |
| Entry Point | 0.8430 |
| Take Profit | 0.8330 |
| Stop Loss | 0.8500 |
| Key Levels | 0.8330, 0.8430, 0.8520, 0.8660 |
| Alternative scenario | |
|---|---|
| Recommendation | BUY STOP |
| Entry Point | 0.8520 |
| Take Profit | 0.8660 |
| Stop Loss | 0.8460 |
| Key Levels | 0.8330, 0.8430, 0.8520, 0.8660 |
Current trend
After a significant decline in August, the USD/CHF pair is trading in a correction trend at 0.8482.
The franc remains stable despite negative reports from the State Secretariat for Economic Affairs (SECO), which showed growth in seasonally adjusted unemployment in August of 0.1% to 2.4%, driven by an increase of 3.4% or 3.638K to 111.354K MoM. Compared to August 2023, the indicator has added 21.473K or 23.9%. In the specified period, 180.236K job seekers were registered, which is 1.097K or 0.6% more than in the previous month, and the value increased by 27.919K or 18.3% YoY. The number of open vacancies changed by –0.428K or –1.2% MoM and by –11.120K or –23.5% YoY. Thus, after a stable period at the beginning of summer, the national labor market is again facing a shortage of jobs.
The American dollar regained some of its lost positions and is trading at 101.50 in USDX. Ahead of the US Fed meeting due on September 18, many regulator officials will make monetary policy assessments this week, which is of great interest to investors since poor data on the labor market may slightly adjust the agency’s plans. Thus, at the moment, according to the Chicago Mercantile Exchange (CME) FedWatch Instrument, the probability of a reduction in the cost of borrowing by 25 basis points to 5.00–5.25% is 71.0%, which will probably not affect the quotes of the national currency.
Support and resistance
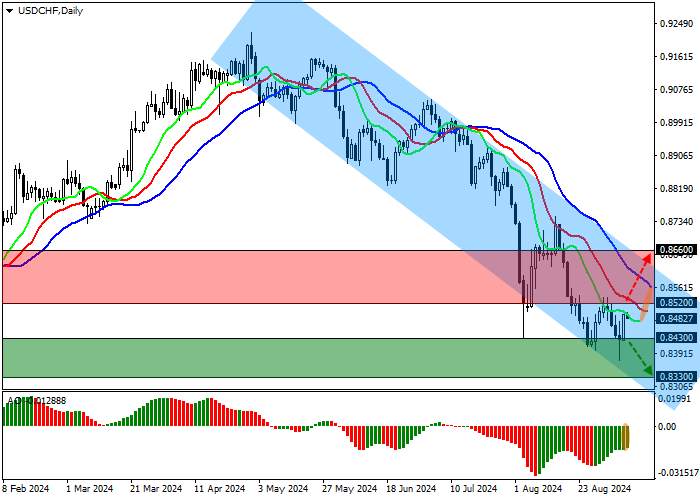
On the daily chart, the trading instrument is correcting near the support line of the downward channel 0.8600–0.8330.
Technical indicators maintain a stable sell signal: fast EMAs on the Alligator indicator are below the signal line, and the AO histogram forms correction bars in the sell zone.
Resistance levels: 0.8520, 0.8660.
Support levels: 0.8430, 0.8330.

Trading tips
Short positions may be opened after the price declines and consolidates below 0.8430, with the target at 0.8330. Stop loss is 0.8500. Implementation period: 7 days or more.
Long positions may be opened after the price grows and consolidates above 0.8520, with the target at 0.8660. Stop loss is around 0.8460.
风险提示:本文所述仅代表作者个人观点,不代表 Followme 的官方立场。Followme 不对内容的准确性、完整性或可靠性作出任何保证,对于基于该内容所采取的任何行为,不承担任何责任,除非另有书面明确说明。

暂无评论,立马抢沙发