


| Scenario | |
|---|---|
| Timeframe | Weekly |
| Recommendation | SELL STOP |
| Entry Point | 82.70 |
| Take Profit | 79.44, 75.09 |
| Stop Loss | 84.31 |
| Key Levels | 75.09, 79.44, 82.73, 85.89, 90.35, 94.27 |
| Alternative scenario | |
|---|---|
| Recommendation | BUY STOP |
| Entry Point | 85.90 |
| Take Profit | 90.35, 94.27 |
| Stop Loss | 84.31 |
| Key Levels | 75.09, 79.44, 82.73, 85.89, 90.35, 94.27 |
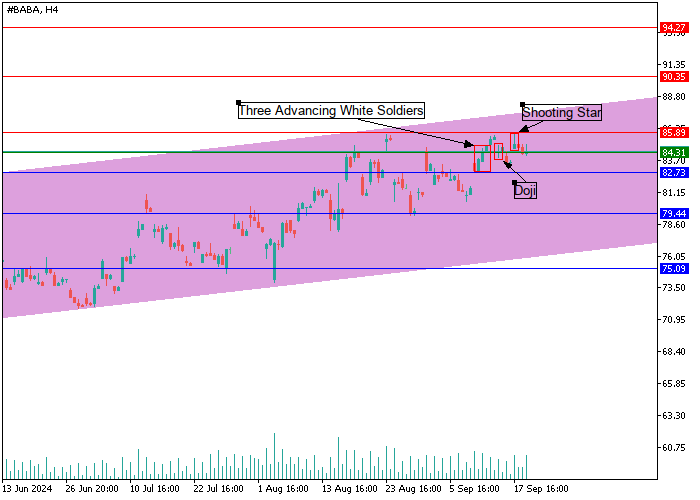
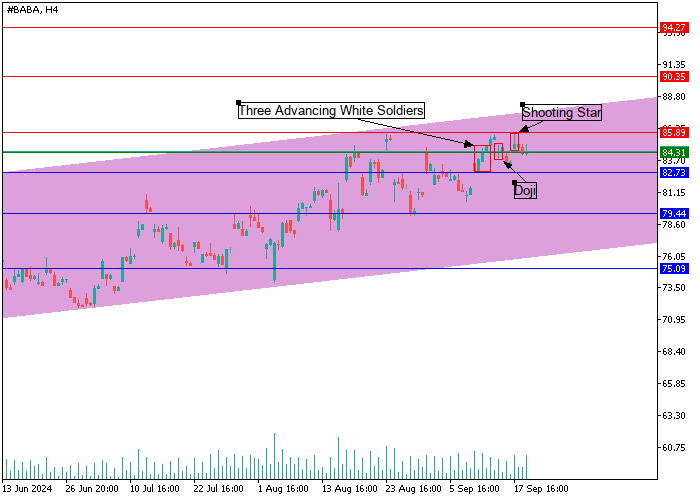
Alibaba Group Holdings Ltd., H4
On the H4 chart, the share price of Alibaba Group Holdings Ltd., one of the largest companies in the field of online commerce, is moving within the framework of an uptrend and is currently holding around 84.31. In the price range of 82.73–84.31, the "bulls" formed a "Three Advancing White Soldiers" pattern of continuation of the trend, after which the asset quotes reached the key resistance level of 85.89 and reversed around, forming the "Doji" pattern. After that, the trading instrument formed a "Shooting Star" reversal model of the candlestick analysis, once again pushing off from the level of 85.89. In the current situation, most likely, one can expect a downward correction of the price to the lower limit of the trend, which lies at 79.44, from where an upward reversal is possible. Overcoming the key support level of 82.73 will be a catalyst for opening short positions with a target of 79.44, and in the case of an impulsive overcoming of the trend line, the next target may be 75.09. If the "bulls" continue to restore the price and consolidate above the level of 85.89, this will become a driver for further growth to the area of 90.35–94.27.
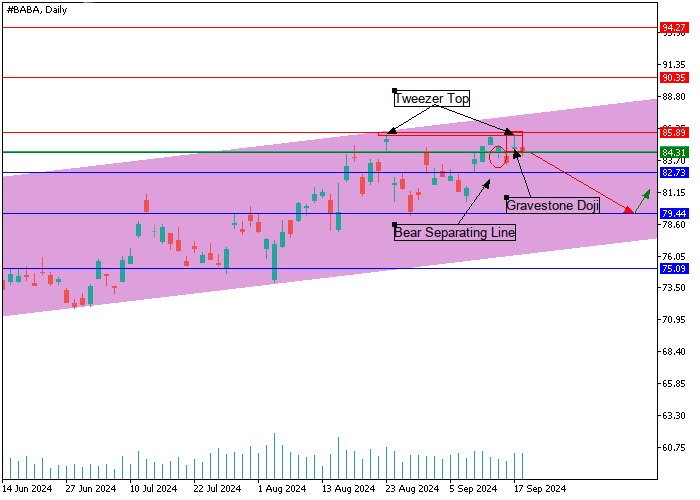
Alibaba Group Holdings Ltd., D1
The D1 chart shows the construction of the "Tweezer Top" candlestick pattern at the key resistance level of 85.89, which signals pressure on the price from sellers, as well as the "Bear Separating Line" model and "Gravestone Doji" at the level of 84.31, which confirm the growth in the number of short positions. Most likely, a downward correction will form in the near future, and overcoming the support level of 82.73 may strengthen the negative dynamics to the area of 79.44–75.09.
Support and resistance
Support levels: 82.73, 79.44, 75.09.
Resistance levels: 85.89, 90.35, 94.27.
Trading tips
Short positions can be opened below 82.73 with targets of 79.44, 75.09. Stop-loss – 84.31. Implementation period: 7 days and more.
Long positions can be opened above the 85.89 mark with targets of 90.35, 94.27. Stop-loss – 84.31.
风险提示:本文所述仅代表作者个人观点,不代表 Followme 的官方立场。Followme 不对内容的准确性、完整性或可靠性作出任何保证,对于基于该内容所采取的任何行为,不承担任何责任,除非另有书面明确说明。
 暂无评论。 来发表第一条观点吧。