


| Scenario | |
|---|---|
| Timeframe | Weekly |
| Recommendation | BUY |
| Entry Point | 227.76 |
| Take Profit | 260.00, 280.00 |
| Stop Loss | 213.70 |
| Key Levels | 181.40, 191.80, 213.70, 260.00, 280.00 |
| Alternative scenario | |
|---|---|
| Recommendation | SELL STOP |
| Entry Point | 213.65 |
| Take Profit | 191.80, 181.40 |
| Stop Loss | 220.95 |
| Key Levels | 181.40, 191.80, 213.70, 260.00, 280.00 |
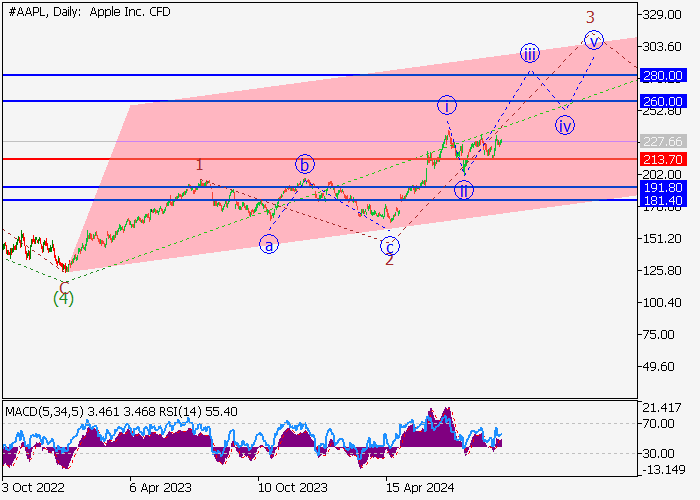
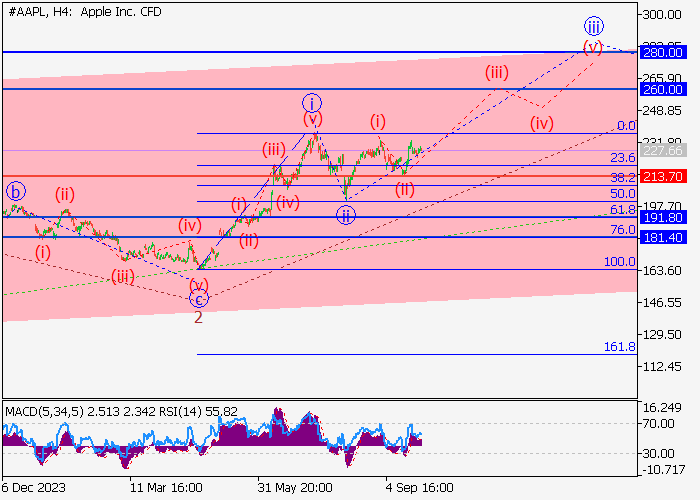
The price may grow.
On the daily chart, the fifth wave of the higher level (5) forms, within which the wave 1 of (5) ended, a correction ended as the second wave 2 of (5), and the third wave 3 of (5) forms. Now, the third wave of the lower level iii of 3 is developing, within which the wave (iii) of iii is forming. If the assumption is correct, the asset will grow to the area of 260.00– 280.00. In this scenario, critical stop loss level is 213.70.
Main scenario
Long positions will become relevant above the level of 213.70 with the targets at 260.00– 280.00. Implementation period: 7 days and more.
Alternative scenario
A breakout and the consolidation of the price below the level of 213.70 will let the asset go down to the area of 191.80–181.40.
风险提示:本文所述仅代表作者个人观点,不代表 Followme 的官方立场。Followme 不对内容的准确性、完整性或可靠性作出任何保证,对于基于该内容所采取的任何行为,不承担任何责任,除非另有书面明确说明。
 暂无评论。 来发表第一条观点吧。