


| Scenario | |
|---|---|
| Timeframe | Weekly |
| Recommendation | BUY STOP |
| Entry Point | 576.00 |
| Take Profit | 616.00 |
| Stop Loss | 568.00 |
| Key Levels | 470.00, 511.00, 543.00, 554.00, 567.00, 576.00, 616.00 |
| Alternative scenario | |
|---|---|
| Recommendation | SELL STOP |
| Entry Point | 554.00 |
| Take Profit | 511.00 |
| Stop Loss | 565.00 |
| Key Levels | 470.00, 511.00, 543.00, 554.00, 567.00, 576.00, 616.00 |
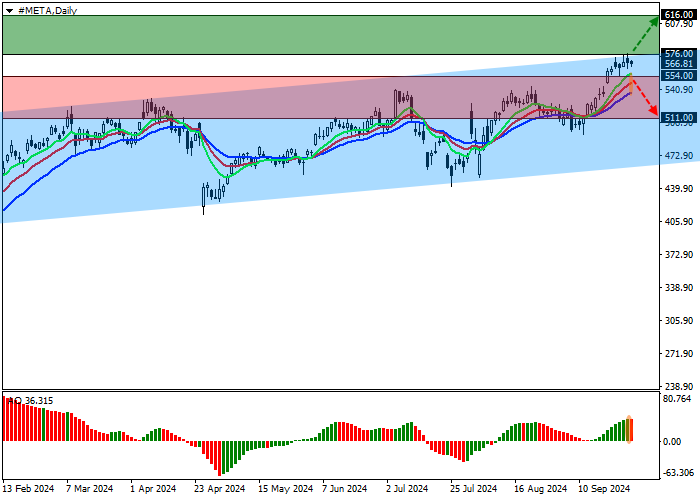
Shares of Meta Platforms Inc., an American multinational holding company owning a technology conglomerate and the largest Facebook social network, are trading at 567.00.
A correction trend is forming on the daily chart, within which the price is held in a wide ascending channel with dynamic boundaries of 576.00–470.00.
On the four-hour chart, the quotes reached the resistance line of 476.00. Despite the slowdown, a consolidation above the year’s high of 543.00 may follow.
Technical indicators maintain a buy signal: fast EMAs on the Alligator indicator are moving away from the signal line, and the AO histogram is forming correction bars in the buy zone.

Trading tips
Long positions may be opened after the price grows and consolidates above 576.00, with the target at 616.00. Stop loss — 568.00. Implementation period: 7 days or more.
Short positions may be opened after the price declines and consolidates below 554.00, with the target at 511.00. Stop loss — 565.00.
风险提示:本文所述仅代表作者个人观点,不代表 Followme 的官方立场。Followme 不对内容的准确性、完整性或可靠性作出任何保证,对于基于该内容所采取的任何行为,不承担任何责任,除非另有书面明确说明。
 暂无评论。 来发表第一条观点吧。