


Hello Traders! Today, we will look at the Weekly Elliott Wave structure of Novo Nordisk A/S ($NVO) and explain why the stock should soon react higher from a Blue Box area.
Novo Nordisk A/S is a Danish multinational pharmaceutical company headquartered in Bagsværd with production facilities in nine countries and affiliates or offices in five countries. Novo Nordisk manufactures and markets pharmaceutical products and services, specifically diabetes care medications and devices.
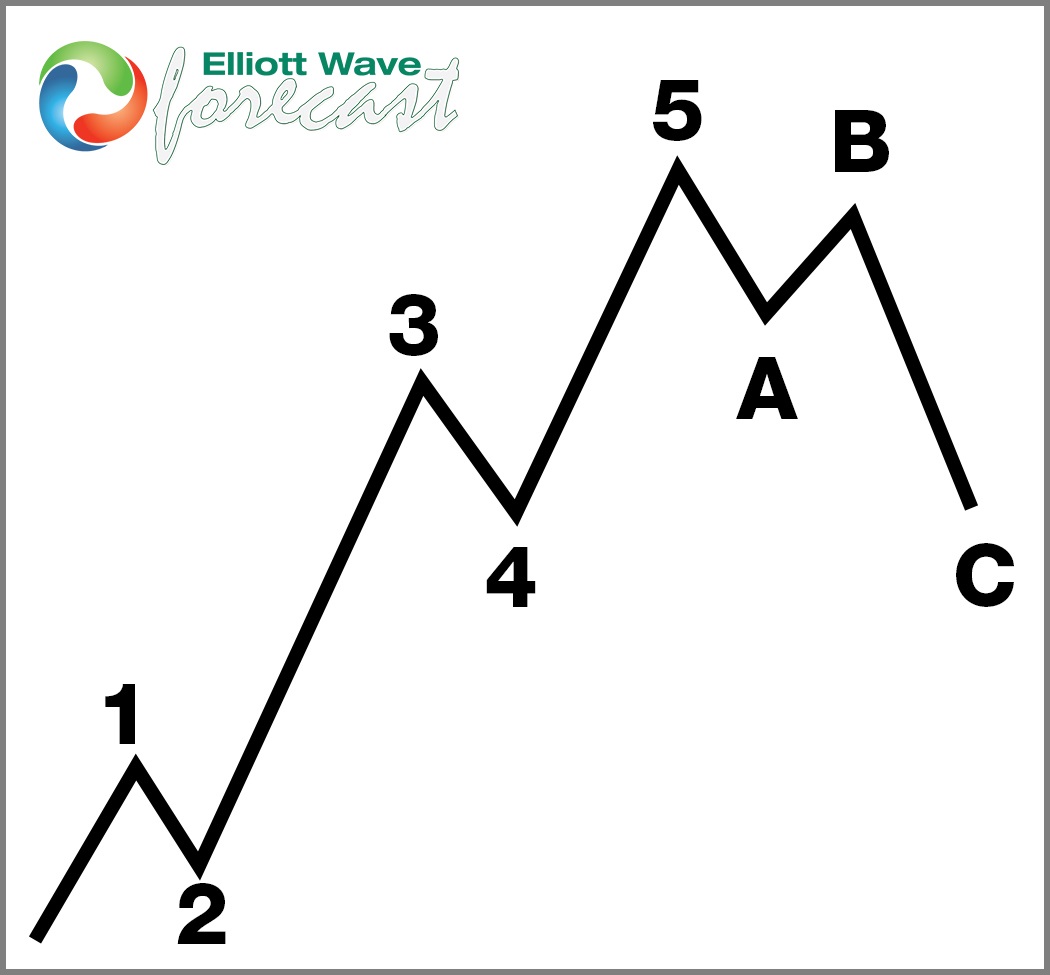
5 Wave Impulse Structure + ABC correction
$NVO Weekly Elliott Wave View November 4th 2024:
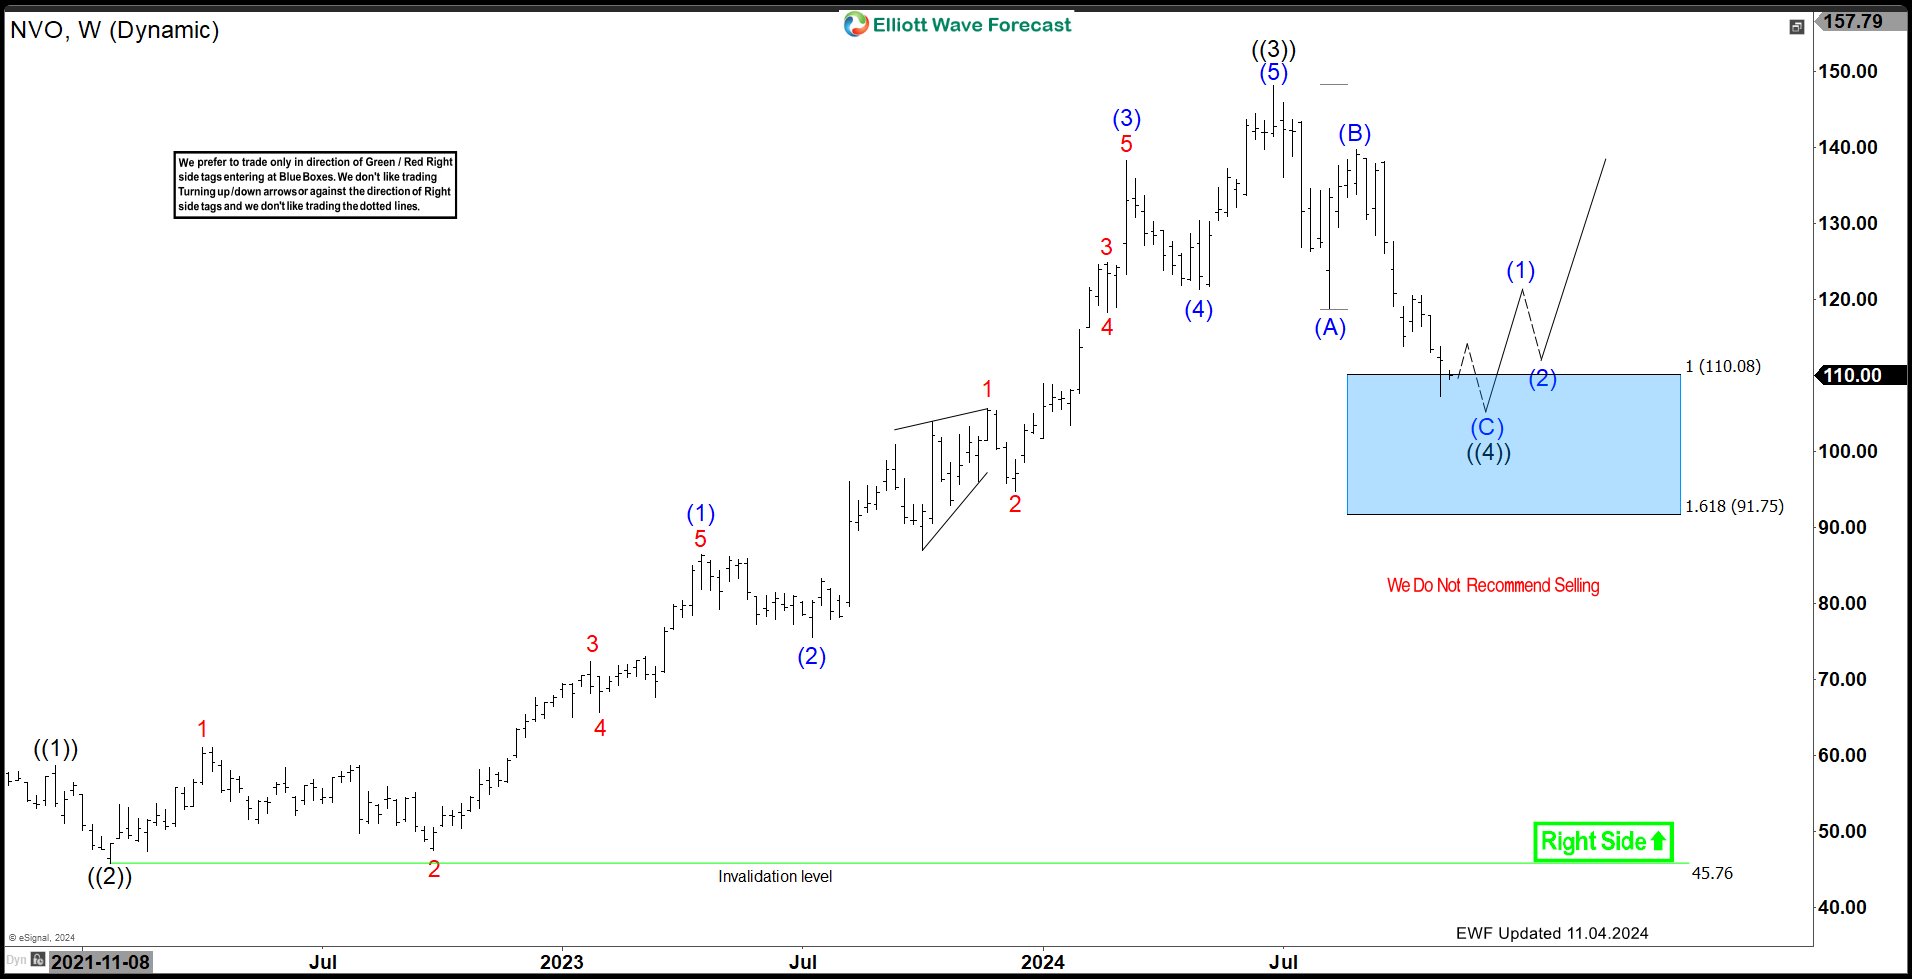
The weekly chart of Novo Nordisk A/S ($NVO) reveals key patterns based on Elliott Wave Theory. This analysis provides a roadmap for traders to plan their next steps effectively.
Breaking Down $NVO’s Recent Price Action
Since the January 2021 low, $NVO has followed a classic 5-wave impulse pattern, indicating a strong trend. Here’s what has happened so far:
- Wave ((1)) ended on December 13, 2021, marking the first impulse.
- Afterward, the stock pulled back in a 3-wave correction (ABC), eventually bottoming out at wave ((2)).
- $NVO then rallied once more, completing wave ((3)) on June 24, 2024.
- Now, wave ((4)) is in progress, and the price is approaching a potential support area known as the Blue Box, which ranges from $110.08 to $91.75.
The Blue Box: A Key Area to Watch
The Blue Box represents a crucial zone where buyers could step in and start the next rally toward wave ((5)). Typically, corrections occur in 3, 7, or 11 swings, so traders should remain cautious and manage their risk.
Here’s What to Keep in Mind:
- Stay above the Invalidation Level: As long as the price holds above $91.75, the bullish outlook remains intact. A drop below this level would require a new analysis.
- Avoid Short Selling: The anticipated decline toward the Blue Box might tempt some to sell, but this carries risks. A truncation could occur, cutting the move short. Instead, watch for signs of a bounce in the Blue Box as a signal for the next rally.
Smart Risk Management
Because the correction could extend into 7 swings, consider taking partial profits on the first bounce. By doing this, you protect some gains and make your remaining position risk-free, setting yourself up for the potential wave ((5)) rally.
Why Elliott Wave Theory Points to a Rally
Elliott Wave Theory helps traders understand market trends and sentiment shifts. In this case, it suggests that once wave ((4)) finishes, NVO could start a new upward leg, aiming for fresh highs with wave ((5)).
Conclusion
With NVO nearing a crucial support zone in its Elliott Wave cycle, traders should stay alert for a potential rally. As long as the stock remains above the $91.75 level, the chances of a bullish move increase. Use this analysis to guide your trading strategy and anticipate what’s next.
风险提示:本文所述仅代表作者个人观点,不代表 Followme 的官方立场。Followme 不对内容的准确性、完整性或可靠性作出任何保证,对于基于该内容所采取的任何行为,不承担任何责任,除非另有书面明确说明。
 暂无评论。 来发表第一条观点吧。