


Hello everyone! In today’s article, we’ll examine the recent performance of Tesla Inc. ($TSLA) through the lens of Elliott Wave Theory. We’ll review how the rally from the November 27, 2024, low unfolded as a 5-wave impulse and discuss our forecast for the next move. Let’s dive into the structure and expectations for this stock.
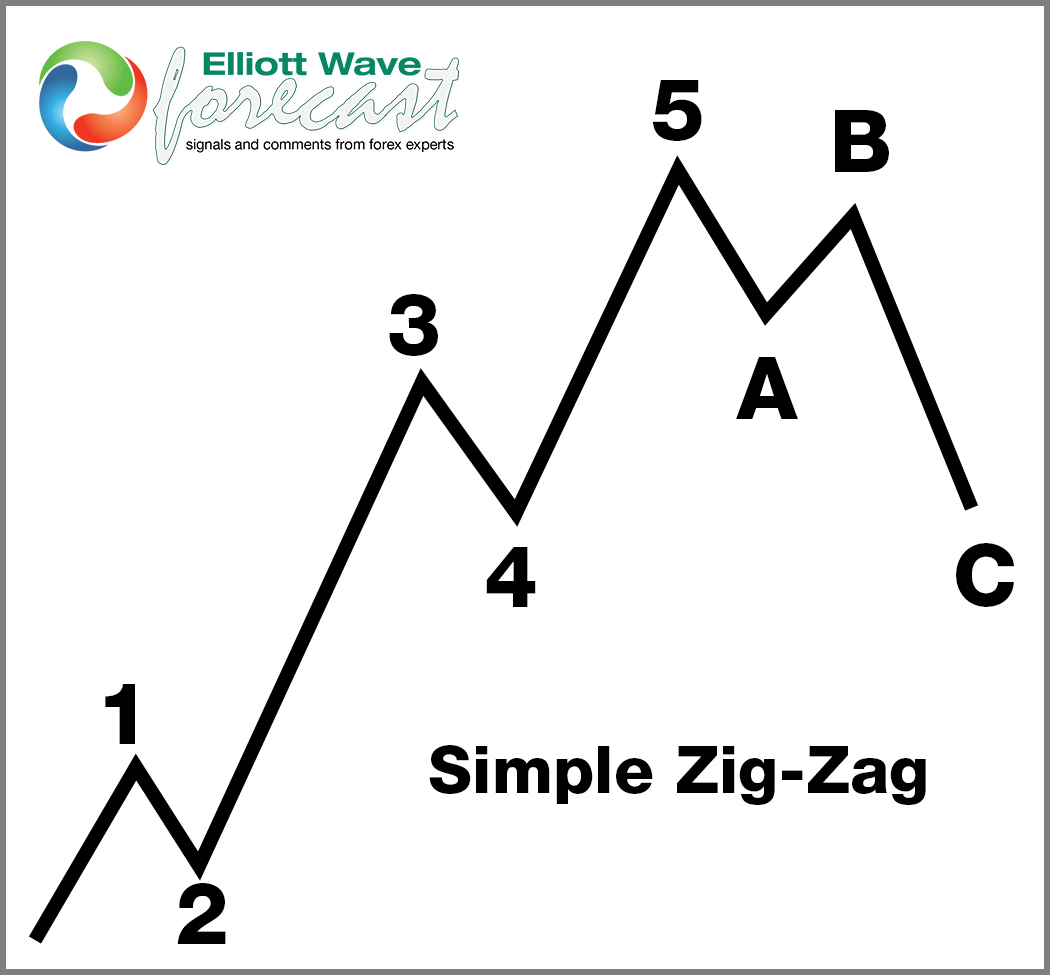
5 Wave Impulse Structure + ABC correction
$TSLA 1H Elliott Wave Chart 12.31.2024:
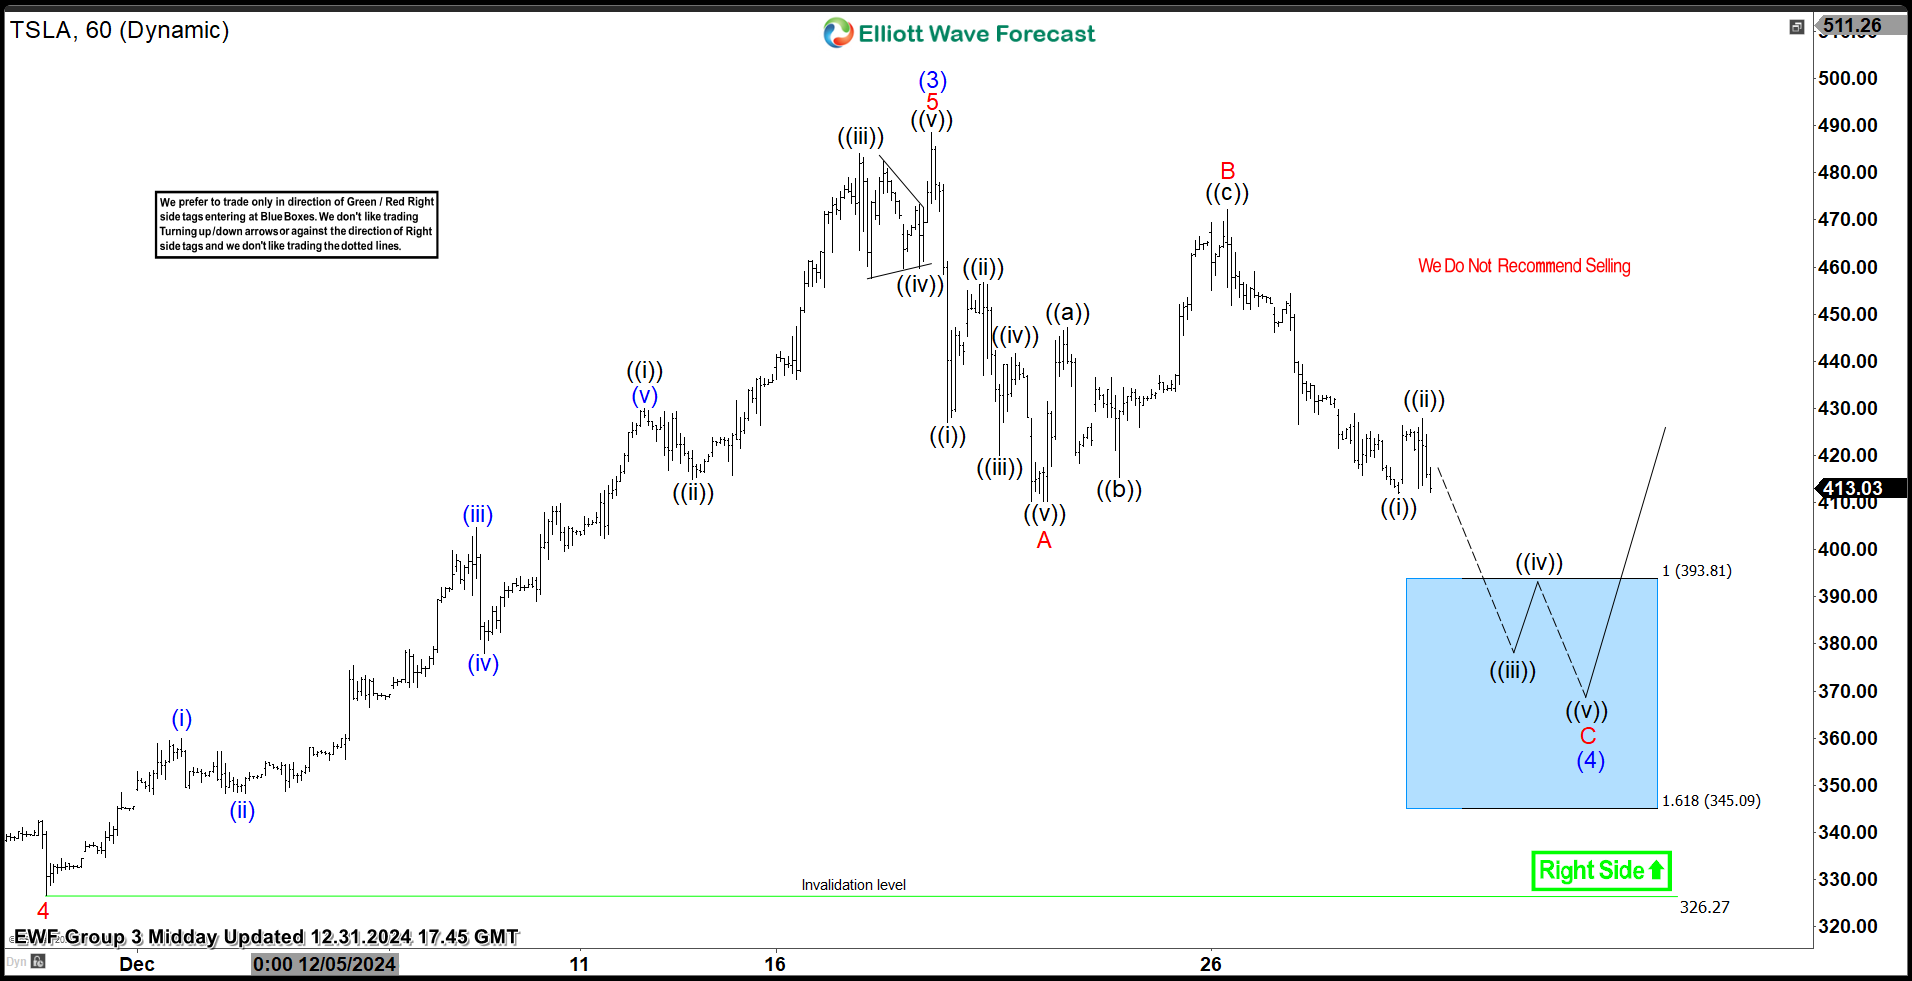
In the 1-hour Elliott Wave count from December 31, 2024, we see that $TSLA completed a 5-wave impulsive cycle beginning on November 27, 2024, and ending on December 18, 2024, at the blue (3). As expected, this initial wave prompted a pullback. We anticipated this pullback to unfold in 3 swings, likely finding buyers in the equal legs area between $393.81 and $345.09.
This setup aligns with a typical Elliott Wave correction pattern (ABC), where the market pauses briefly before resuming the main trend.
$TSLA 1H Elliott Wave Chart 1.06.2025:
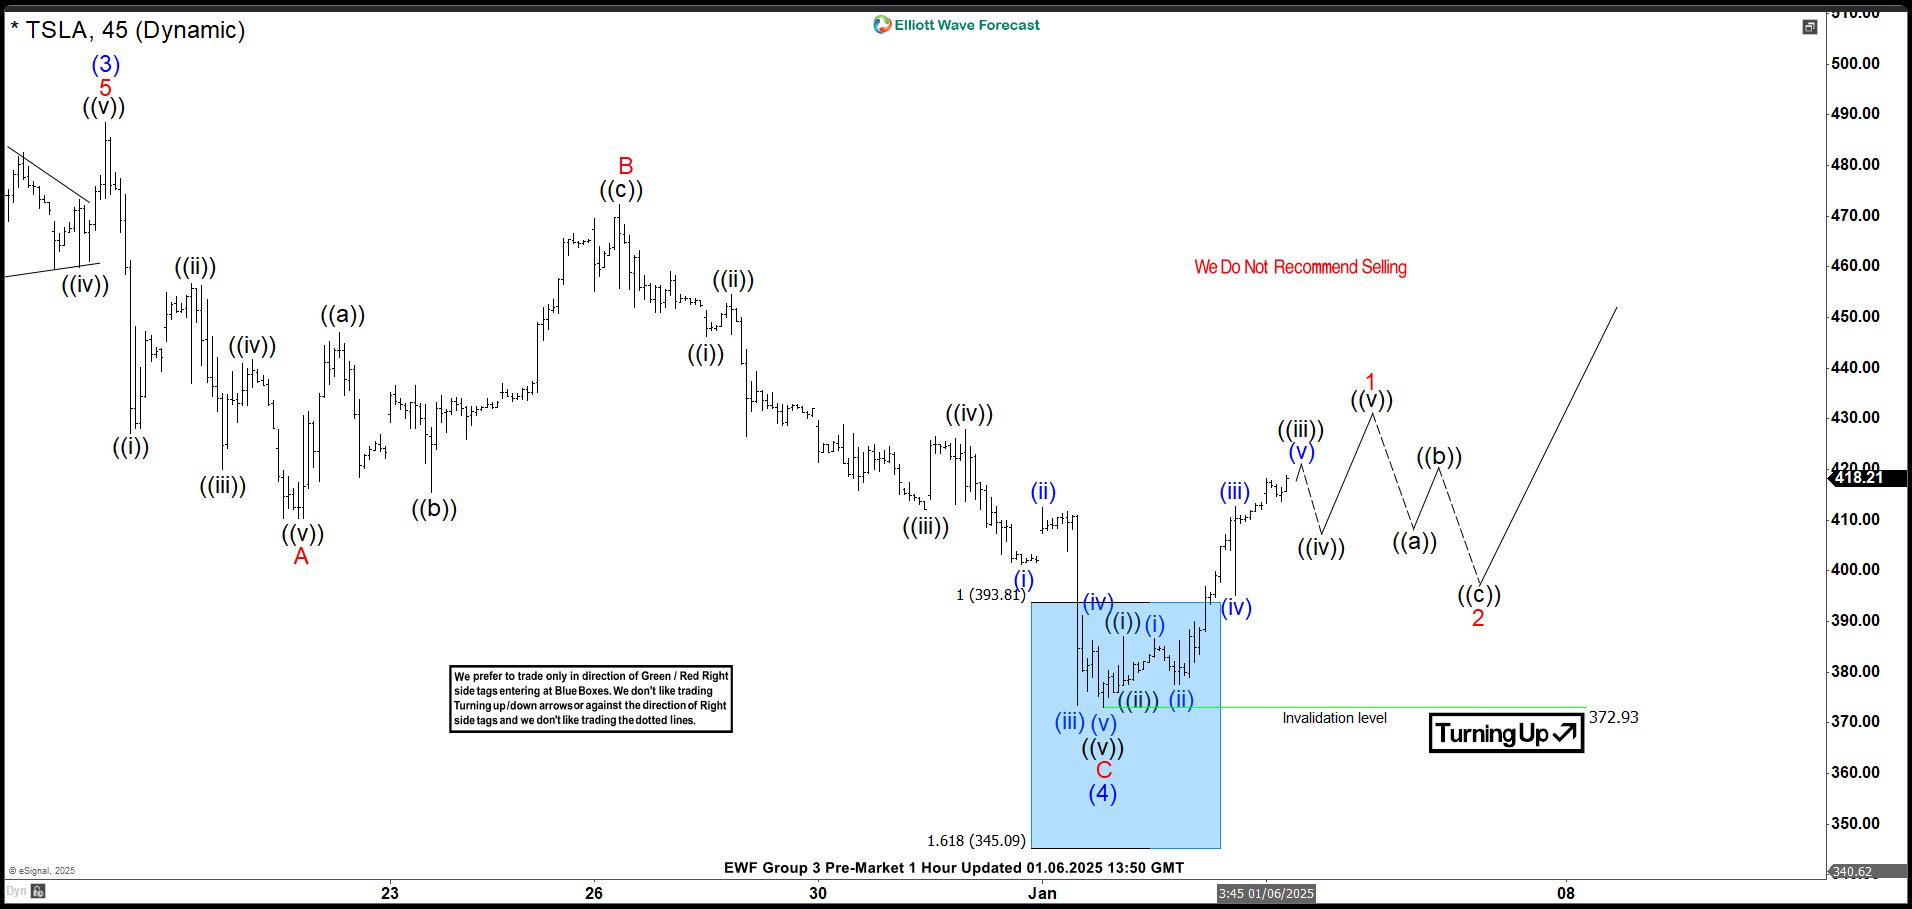 The most recent update, from January 6, 2025, shows that $TSLA reacted as predicted. After the decline from the recent peak, the stock found support in the equal legs area, leading to a renewed rally. As a result, traders could adjust to go risk-free, which confirmed that the bullish trend remains intact.
What’s Next for $TSLA?
With the current rally, $TSLA appears well-supported. Based on the Elliott Wave structure, we expect the stock to continue its upward trajectory, targeting the $515 – $600 range before another potential pullback. Therefore, it is essential to keep monitoring this zone as we approach it.
Conclusion
In conclusion, our Elliott Wave analysis of Tesla Inc. ($TSLA) suggests that it could continue its bullish run in the short term. Therefore, traders should monitor the $515 – $600 zone as the next target, keeping an eye out for any corrective pullbacks. By using Elliott Wave Theory, we can identify potential buying areas and enhance risk management in volatile markets.
风险提示:本文所述仅代表作者个人观点,不代表 Followme 的官方立场。Followme 不对内容的准确性、完整性或可靠性作出任何保证,对于基于该内容所采取的任何行为,不承担任何责任,除非另有书面明确说明。
 暂无评论。 来发表第一条观点吧。