


Elliott Wave Analysis for Binance Coin (BNB/USDT)
This analysis examines Binance Coin (BNB/USDT) on the daily timeframe using Elliott Wave theory.
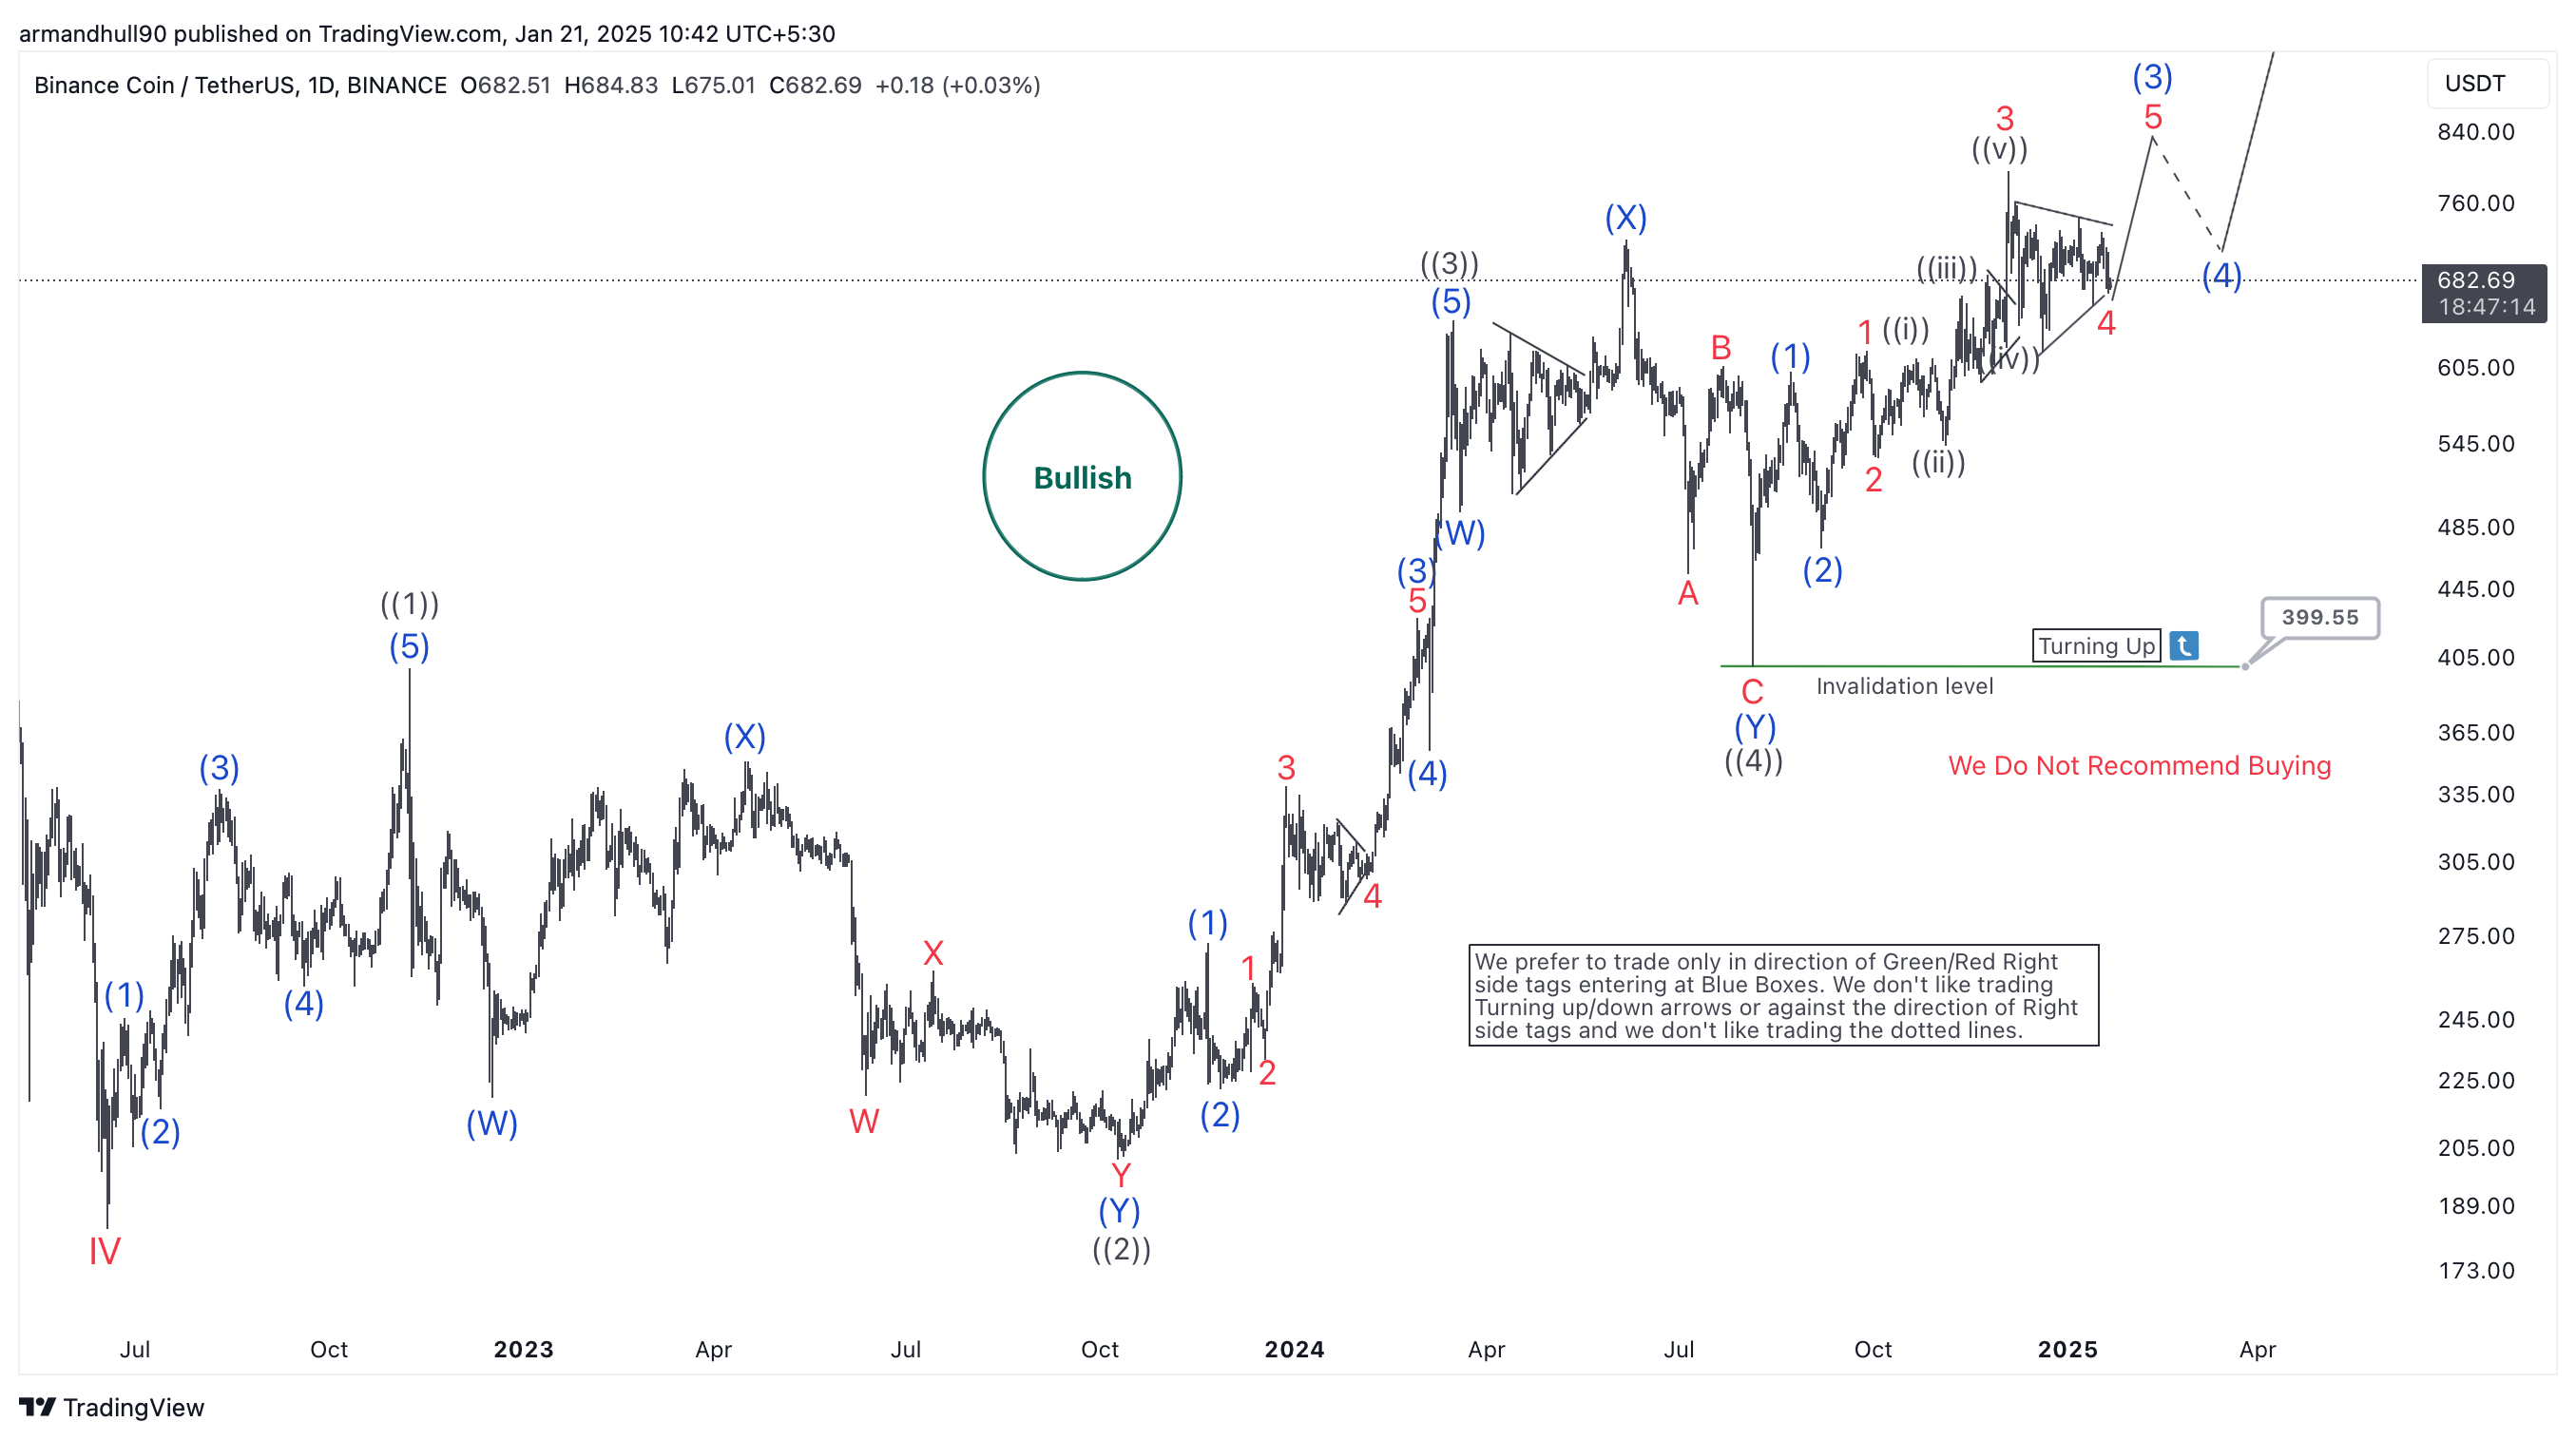
The chart reveals a bullish trend, with the structure currently in wave ((5)), the final phase of a larger impulsive pattern. Wave ((3)) was completed earlier as a five-wave sequence. This confirmed strong upward momentum. Following this, wave ((4)) developed as a corrective WXY pattern. This correction reset the trend and prepared the market for the next impulsive wave.
At present, wave ((5)) is unfolding, subdivided into smaller impulsive waves. Sub waves (1) and (2) are complete, and sub wave (3), the strongest and longest, is ongoing. Within (3), sub wave 4 formed a contracting triangle pattern and nearing its completion. This pattern shows sideways movement and price consolidation near key support levels. Once sub wave 4 finishes, sub wave 5 is expected to drive prices higher mark. This move should surpass the previous high of wave 3. The target range lies between $812.68 and $919.88 which would mark larger (3) followed by a pullback in 3, 7 or 11 swings before turning higher again.
Key Features and Invalidations
Key features in this analysis include the "Turning Up" signal and green right-side tags. These tools align with the bullish outlook. They help traders identify favorable opportunities. Taking trades against the trend is discouraged, including shorting within the levels provided or following dotted-line projections.
The invalidation level is below the low of wave ((4)). A break below this level would negate the bullish scenario. In such a case, the trend would need to be reassessed.
风险提示:本文所述仅代表作者个人观点,不代表 Followme 的官方立场。Followme 不对内容的准确性、完整性或可靠性作出任何保证,对于基于该内容所采取的任何行为,不承担任何责任,除非另有书面明确说明。
 暂无评论。 来发表第一条观点吧。