


The performance of Micron Technology Inc. (MU) stock has been a constant topic of interest in financial markets. Despite strong projections and a track record of innovation in the semiconductor industry, the ability of its stock to sustain a significant rally could be challenged by economic and sector-specific factors. In this article, we will explore the challenges and opportunities Micron faces on its path to sustainable recovery, as well as the potential impact of these dynamics on investors.
MU Weekly Chart October 2024
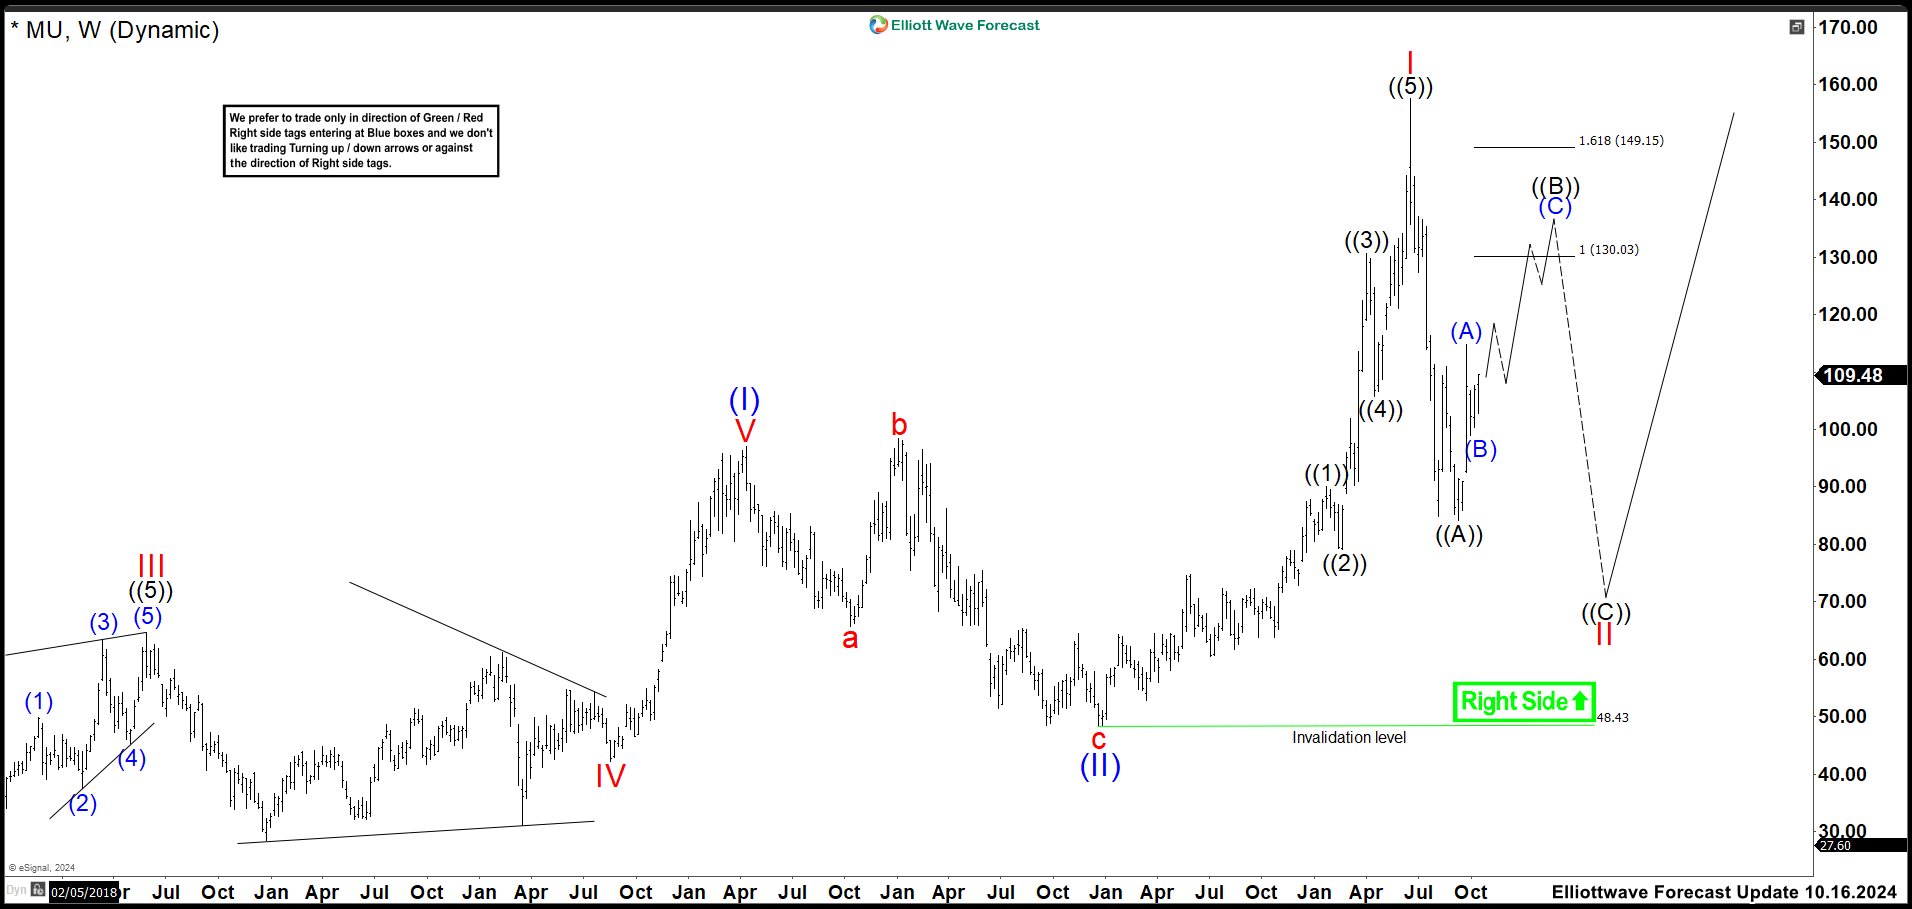
In the last weekly chart of October 2024, MU made a bearish impulse ending at $84.12 low, and we labeled this as wave ((A)) of II. Then, we were anticipating a corrective wave ((B)). Wave (A) ended at $106.75 high, and we identified the correction wave (B) as completed at $98.94 low. We stated that wave (C) had already started a new rally, and we expected it to reach the $130.03–$149.15 area to culminate wave ((B)) and turn lower into ((C)). This idea was valid as long as the market remained below $157.57 or above $48.43. If the market would break above wave I high, then wave II would have already ended.
MU Weekly Chart March 2025
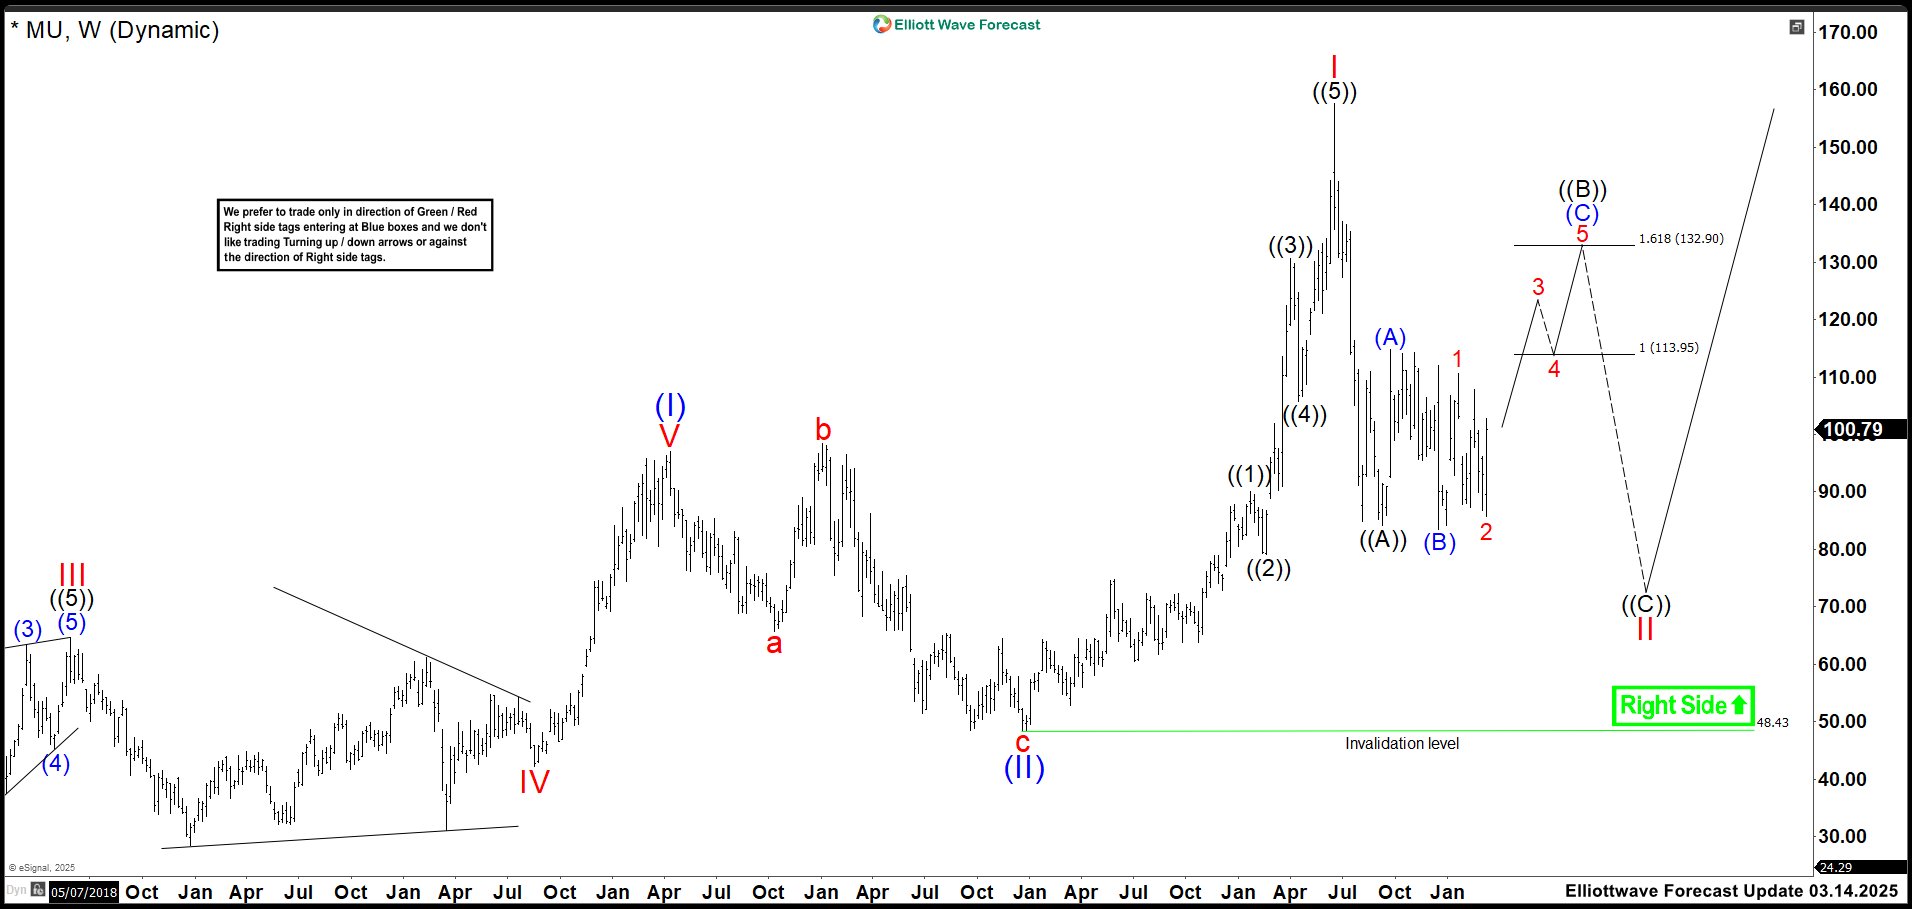
MU shows potential to recover its stock price as technological advancements and a memory market rebound drive growth later in 2025. However, demand fluctuations, global economic pressures, or unexpected market shifts create uncertainty around this recovery. The outlook highlights growth opportunities, but investors must monitor market volatility, which could undermine the rally's sustainability.
The price broke below wave ((A)) low, which suggests wave ((B)) may be completed instead of wave (A). However, the ranging movement more likely indicates wave ((B)) is forming an expanding flat correction. We labeled wave (B) at the 83.54 low, and wave (C) is now progressing as an impulse or an ending diagonal structure. The chart illustrates an upward impulse, targeting the 113.95–132.90 area for wave (C) and ((B)). Afterward, the market will likely react lower to continue wave ((C)) of II. While wave II may already be finished, we are conservatively labeling this rally as part of an expanding flat correction. If MU breaks above wave I high, it confirms wave II is complete. Conversely, if the market breaks below wave (B), wave ((B)) is complete, and wave ((C)) begins moving downward.
风险提示:本文所述仅代表作者个人观点,不代表 Followme 的官方立场。Followme 不对内容的准确性、完整性或可靠性作出任何保证,对于基于该内容所采取的任何行为,不承担任何责任,除非另有书面明确说明。
 暂无评论。 来发表第一条观点吧。