


DexCom Inc., (DXCM) prominent player in the healthcare sector, specializes in continuous glucose monitoring systems, helping improve diabetes management. Listed on Nasdaq under the ticker "DXCM," the company operates on a global scale.
This stock reflects a notable trading pattern, with anticipated market movements providing insights for investors. From a technical perspective, DXCM has been navigating a double three correction pattern since its November 2021 peak.
DXCM - Elliott Wave Latest Weekly View: 
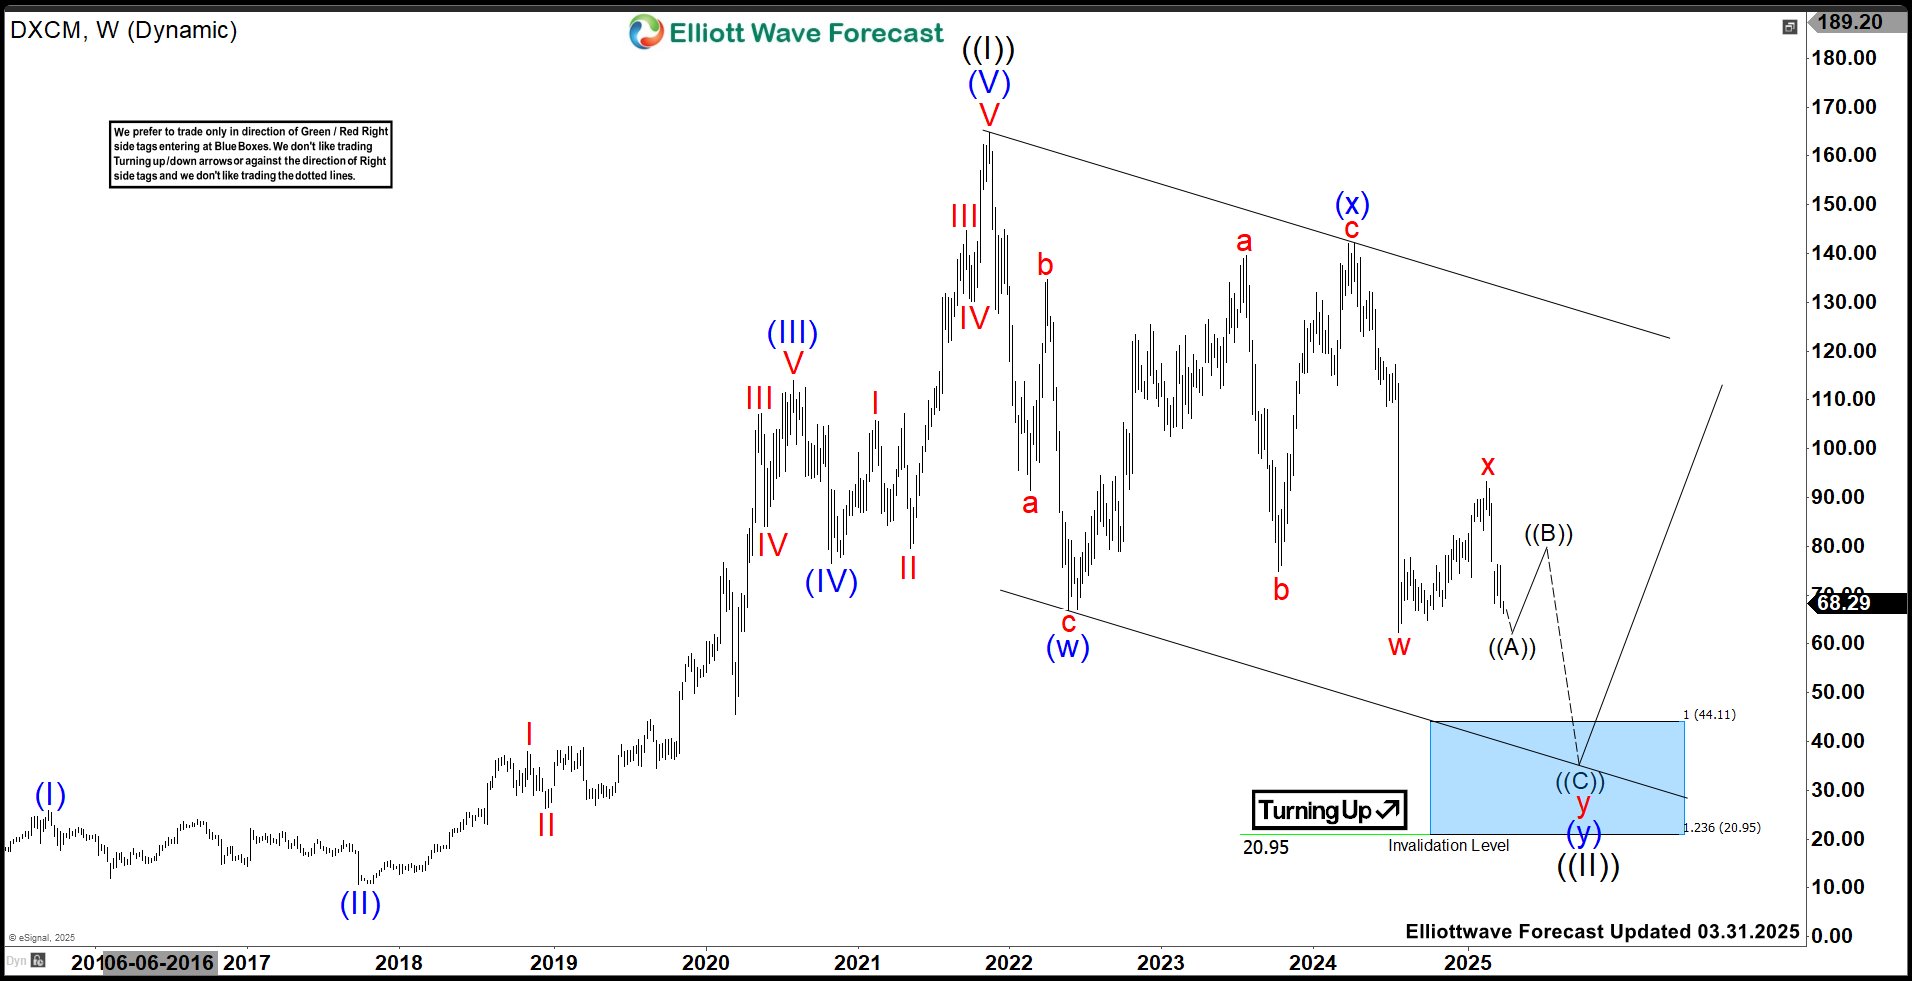
The company's grand super cycle ((I)) reached its zenith at $164.86, marking a high from its all-time low. Following this, the stock has exhibited a corrective wave ((II)), forecasting a gradual decline against the March-2024 high. Within wave ((I)), various smaller waves, such as (w), (x), & (y), have contributed to its dynamic movement. The stock recently broke below the (w) low, suggesting continued weakness towards $44.11 or lower levels—a critical point for investors.
Elliott Wave pattern suggest short-term strategies, such as selling during rebounds in three, seven, or eleven swings, as long as the stock remains below February-2025 high of $93.25, once it breaks below $62.34 low. Alternatively, if the stock surpasses $93.25 while holding above July-2024 low, a potential double correction could manifest. For long-term investments, the next blue box area in wave y might offer opportunities when the stock approaches this zone in the weekly chart. Navigating DXCM’s technical patterns demands careful observation & a strategic approach for investors aiming to capitalize on potential market movements.
风险提示:本文所述仅代表作者个人观点,不代表 Followme 的官方立场。Followme 不对内容的准确性、完整性或可靠性作出任何保证,对于基于该内容所采取的任何行为,不承担任何责任,除非另有书面明确说明。
 暂无评论。 来发表第一条观点吧。