


In this technical blog, we will look at the past performance of the 1-hour Elliott Wave Charts of EURCAD. In which, the rally from 22 November 2024 low is unfolding as an impulse sequence. Therefore, called for an extension higher to take place. We knew that the structure in EURCAD should remain supported & extend higher. So, we advised members not to sell the pair & buy the dips in 3, 7, or 11 swings at the blue box areas. We will explain the structure & forecast below:
EURCAD 1-Hour Elliott Wave Chart From 3.21.2025
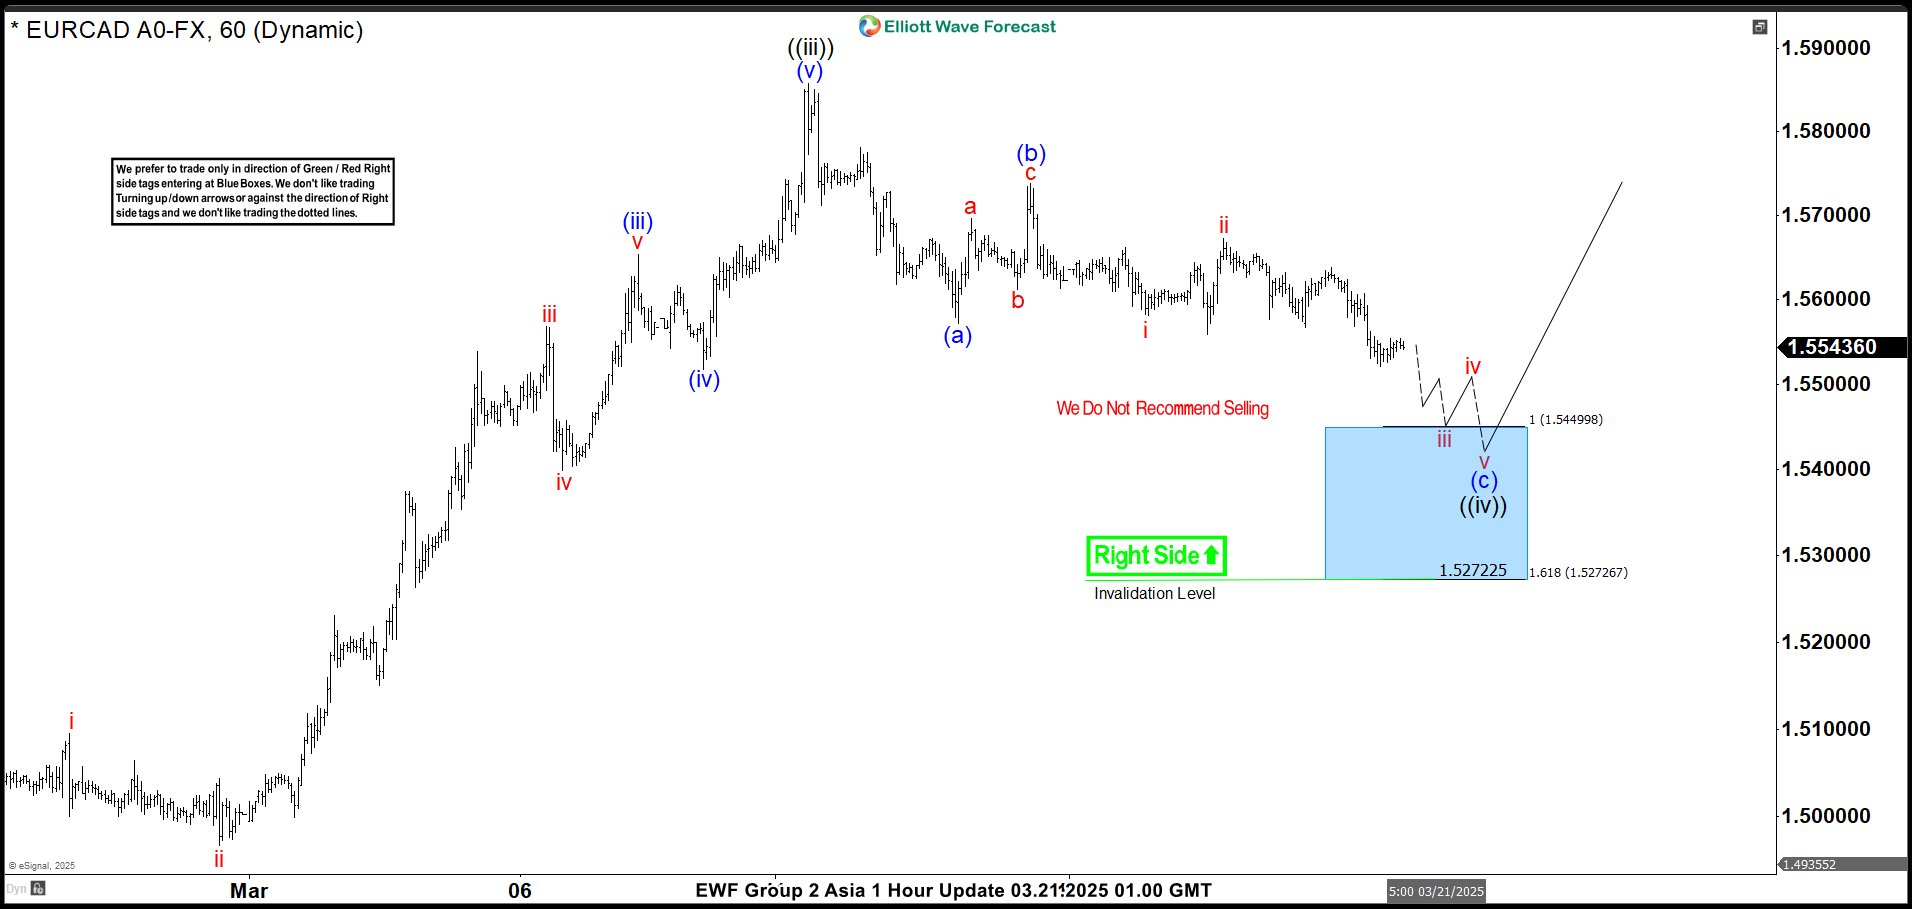
Here’s the 1-hour Elliott wave Chart from the 3.21.2025 Asia update. In which, the rally to 1.5857 high completed wave ((iii)) & made a pullback in wave ((iv)). The internals of that pullback unfolded as Elliott wave zigzag correction where wave (a) ended at 1.5571 low. Then a bounce to 1.5738 high-ended wave (b) & started the next leg lower in wave (c) towards 1.5449- 1.5272 blue box area. From there, buyers were expected to appear looking for new highs ideally or for a 3-wave bounce minimum.
EURCAD Latest 1-Hour Elliott Wave Chart From 4.08.2025
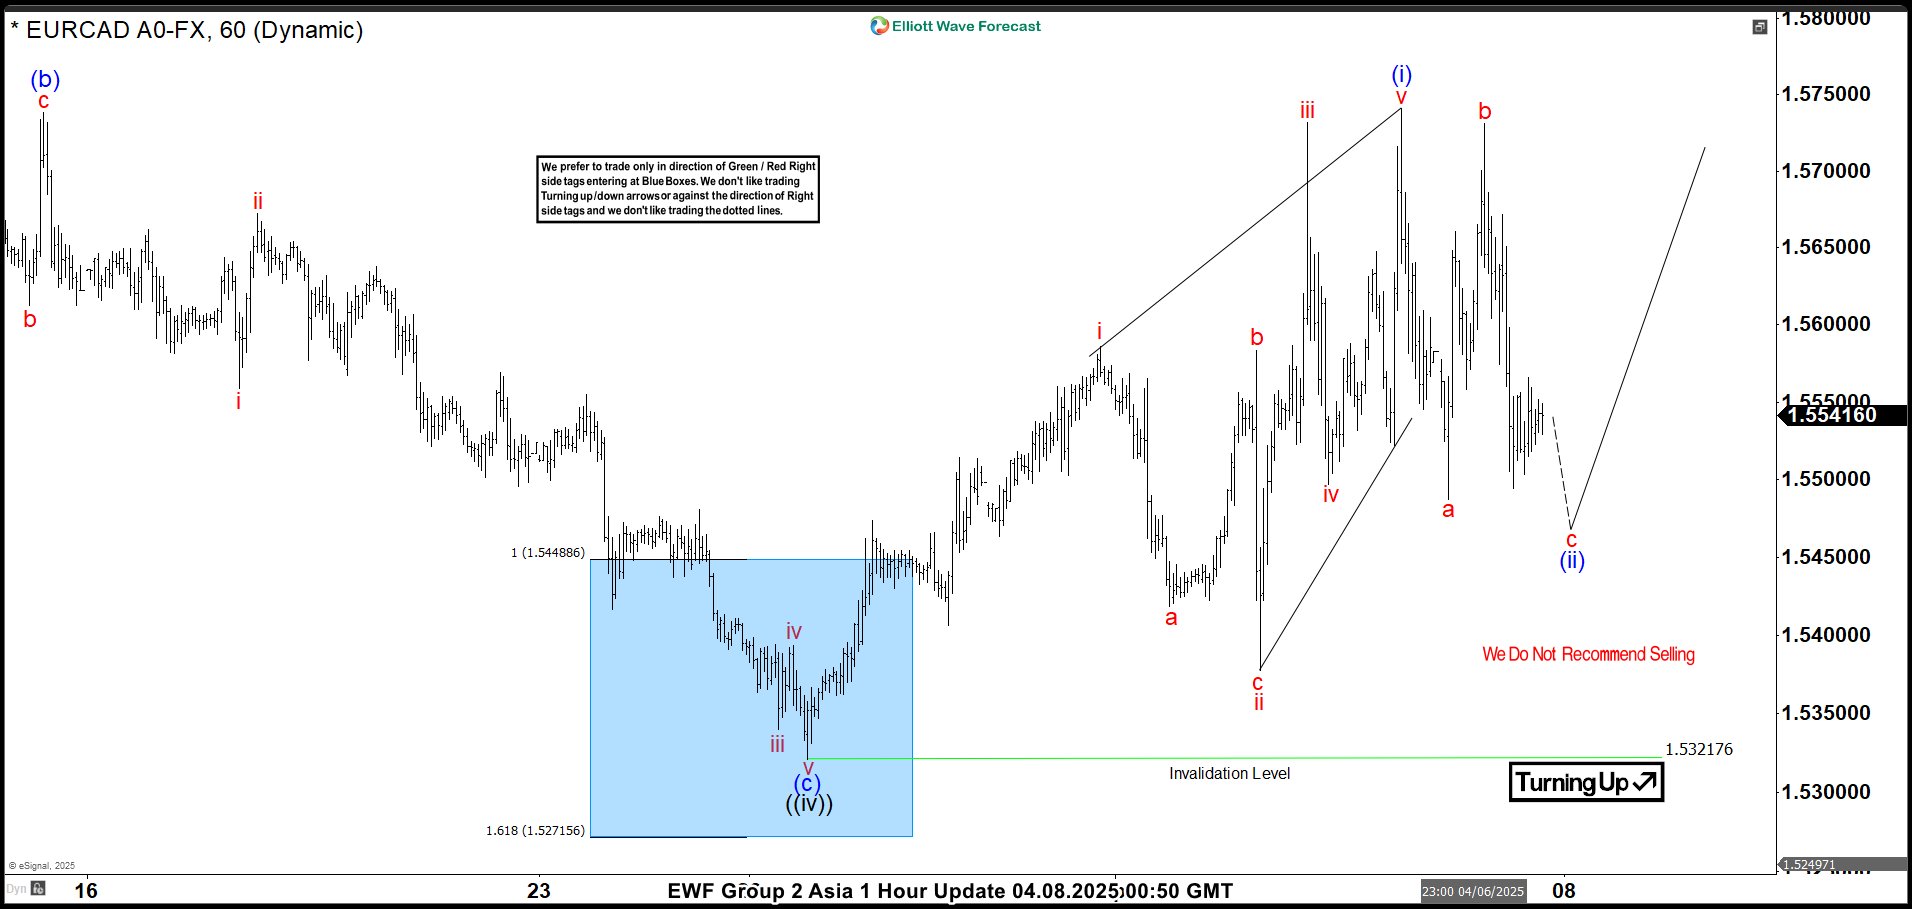
This is the latest 1-hour Elliott wave Chart from the 4.08.2025 Asia update. In which the pair is showing a strong reaction higher taking place, right after ending the zigzag correction within the blue box area. Allowed members to create a risk-free position shortly after taking the long position at the blue box area. However, a break above 1.5857 high is still needed to confirm the next extension higher minimum towards 1.5985- 1.6190 area & avoid double correction lower.
风险提示:本文所述仅代表作者个人观点,不代表 Followme 的官方立场。Followme 不对内容的准确性、完整性或可靠性作出任何保证,对于基于该内容所采取的任何行为,不承担任何责任,除非另有书面明确说明。
 暂无评论。 来发表第一条观点吧。