AT&T Inc. (T) is an American multinational telecommunications holding company headquartered in Dallas, Texas. It is the world's largest telecommunications company by revenue and the third-largest provider of mobile telephone services in the U.S.
AT&T stock continues to gain traction as it approaches the $29.03 resistance zone. Investors are encouraged by its strong free cash flow, consistent dividend yield, and aggressive fiber network expansion. Recent earnings have met expectations, and analysts forecast modest revenue growth supported by wireless and broadband demand. Additionally, the company’s focus on debt reduction and operational efficiency adds to its appeal.
From a price action perspective, $T is developing an impulsive structure, suggesting further upside potential. The stock trades above key moving averages, and momentum indicator like RSI remain supportive. If it breaks above $29.03, a new bullish leg could unfold. Until then, traders may look for consolidation or a pullback as a buying opportunity.
AT&T (T) Monthly Chart September 2024
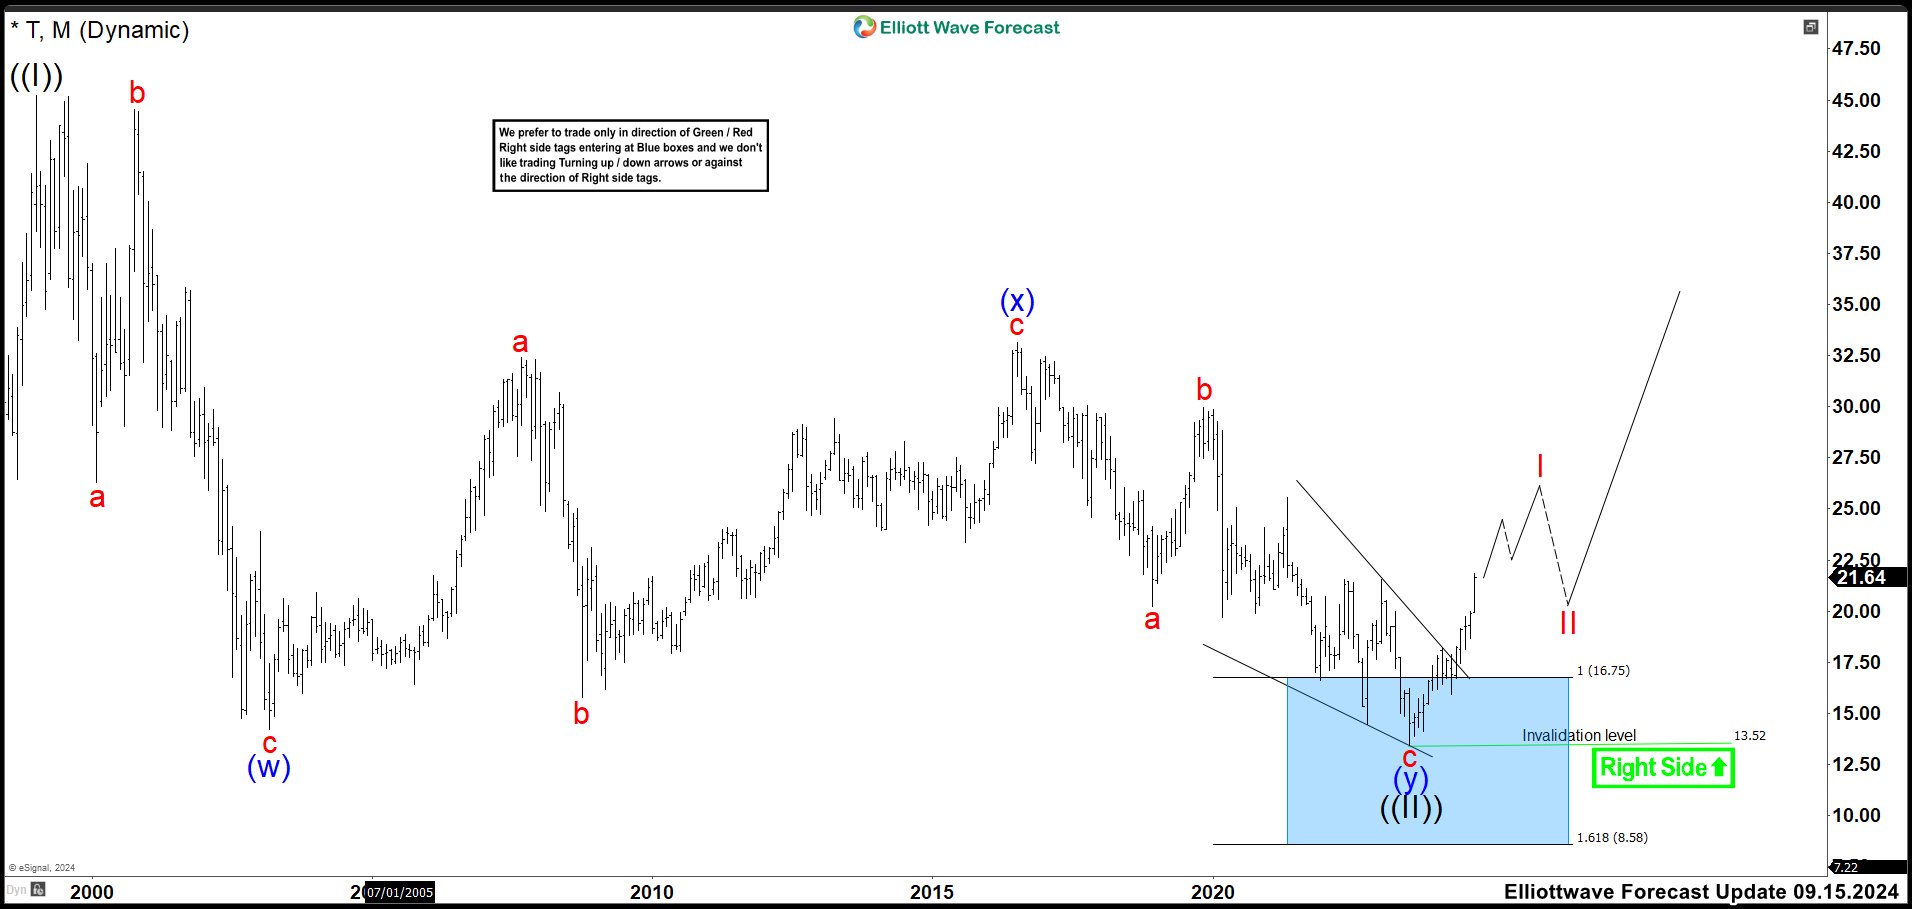 In the last monthly chart in September 2024, we spotted a strong rally from the Blue Box area. That rally looked promising but did not confirm that wave ((II)) ended at $13.43. To validate the end of wave ((II)), the market needed to break above wave ((I))'s high. Until then, the stock had room to form lower structures. Despite that, T performed well and signaled a developing impulsive trend.
AT&T (T) Weekly Chart February 2025
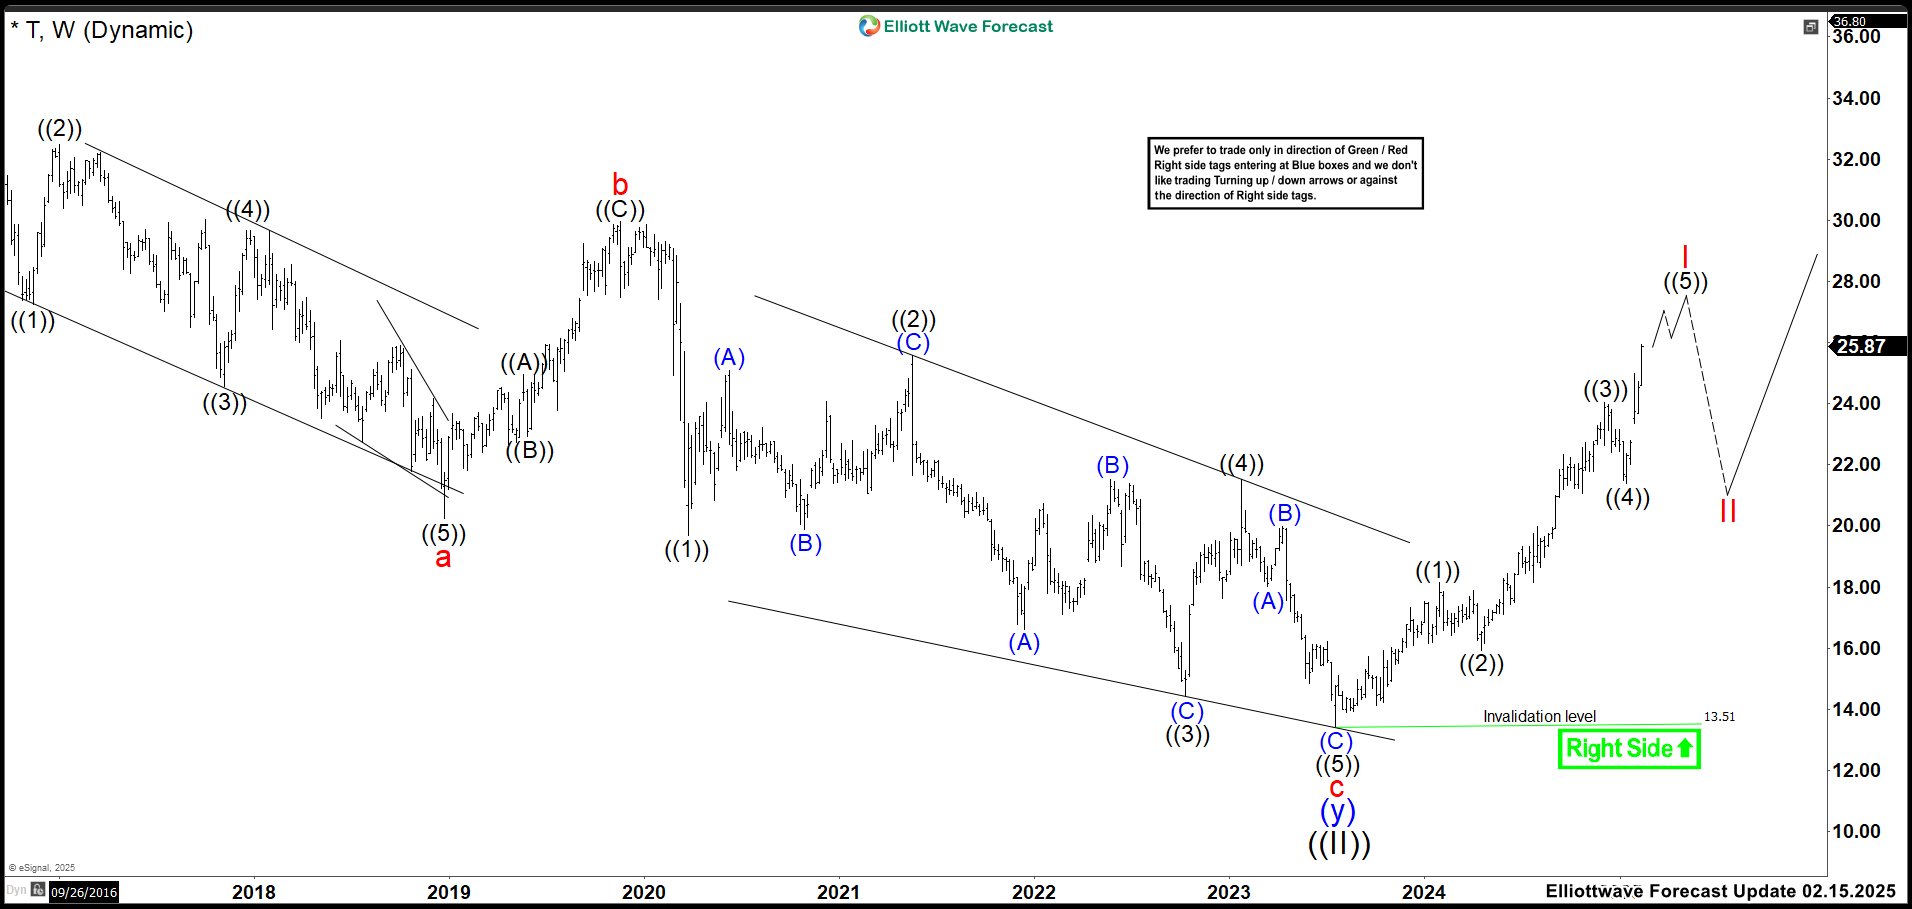
Over the last 5 months, the stock formed a clear five-swing structure, favoring an impulsive outlook. Wave ((3)) ended at the $24.03 high. Then, the market corrected lower and completed wave ((4)) at the $21.38 low. After that, T pushed higher. Strong earnings—better than expected—sparked an aggressive rally. This confirmed continued strength. We tracked wave ((5)) in progress. Specifically, the market was advancing in wave (3) of ((5)).
AT&T (T) Weekly Chart June 2025
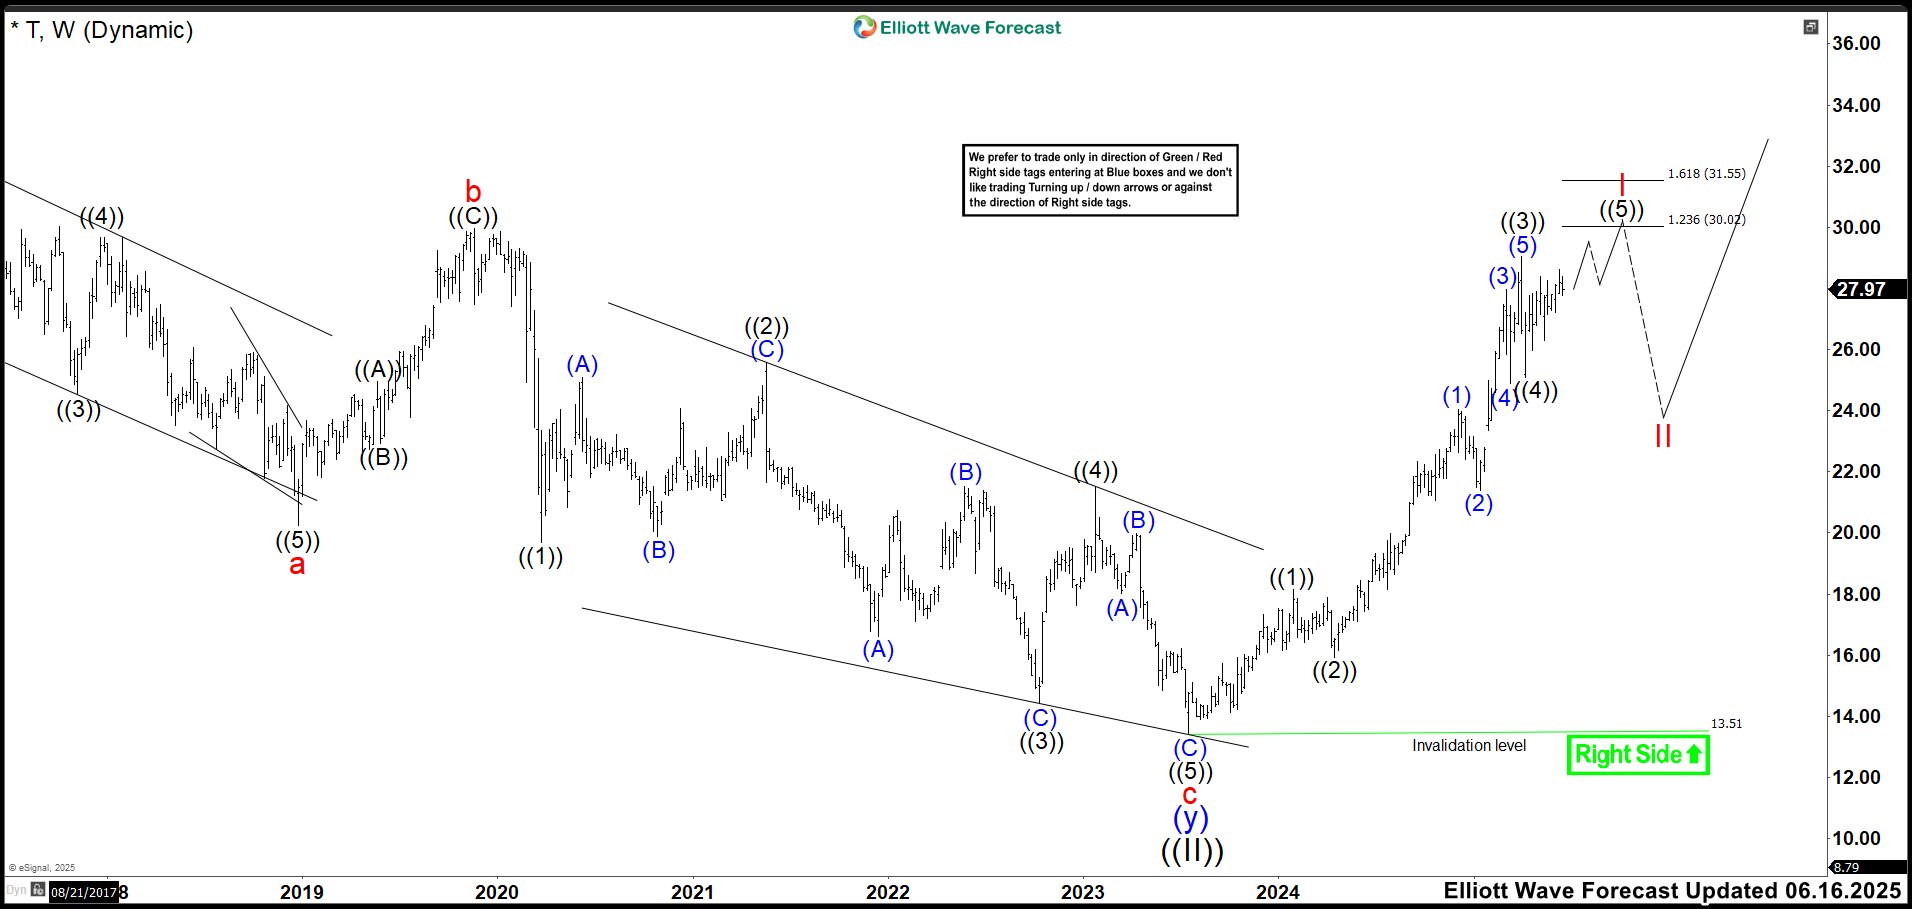
The stock price continues rising as expected, suggesting an extension in wave ((3)) as you can watch in the chart. Wave ((3)) likely ends at 29.03 high and wave ((4)) finds support at 25.10 low. Now, the market must break above 29.03 to drive wave ((5)) toward the 30.02–31.55 area. A bearish reaction in that zone confirms completion of impulse wave I. Still, upward extensions remain possible.
Alternatively, if the market fails to break 29.03, wave ((4)) may still be unfolding. In that case, T could drop toward 24.66–23.72 to finish wave ((4)). Then, the bullish move continues in wave ((5)). A clean break above 29.03 avoids this scenario.
We’ll keep tracking the structure—stay tuned as the market unfolds the next wave—trade smart!
风险提示:本文所述仅代表作者个人观点,不代表 Followme 的官方立场。Followme 不对内容的准确性、完整性或可靠性作出任何保证,对于基于该内容所采取的任何行为,不承担任何责任,除非另有书面明确说明。

暂无评论,立马抢沙发