Platinum (PL) has broken out of its bearish channel this month, signaling strong bullish trend momentum. This article explores the latest long-term Elliott Wave technical outlook.
Platinum (PL) Monthly Elliott Wave Chart
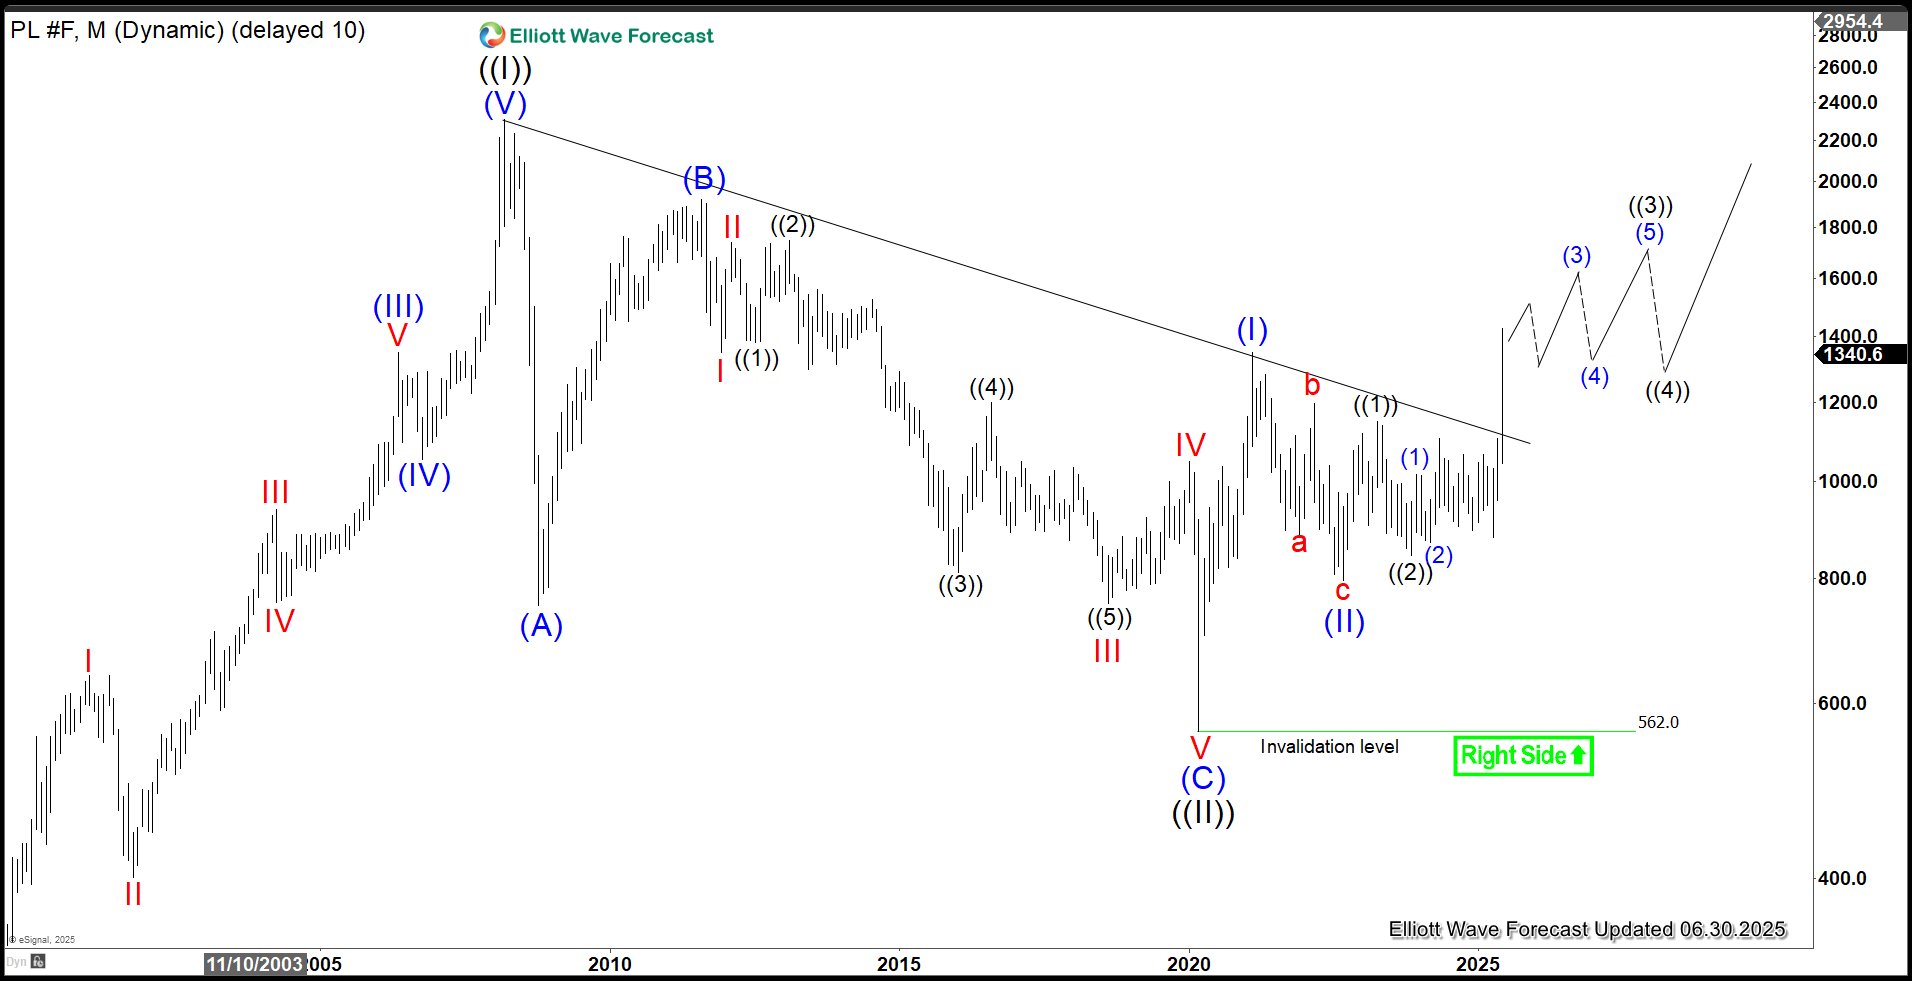
The monthly platinum chart indicates that the Grand Cycle wave ((II)) correction concluded at 562. The metal has since turned bullish, advancing in wave ((III)) with a nested impulse structure. From the wave ((II)) low, wave (I) of ((III)) peaked at 1348.2, followed by a pullback in wave (II) of ((III)) ending at 802.1. Platinum has since resumed its upward trajectory, breaking above the descending bearish trendline from the March 2008 peak, confirming a strong bullish shift. The metal is expected to continue rallying within its nested impulsive structure.
Platinum (PL) Daily Elliott Wave Chart
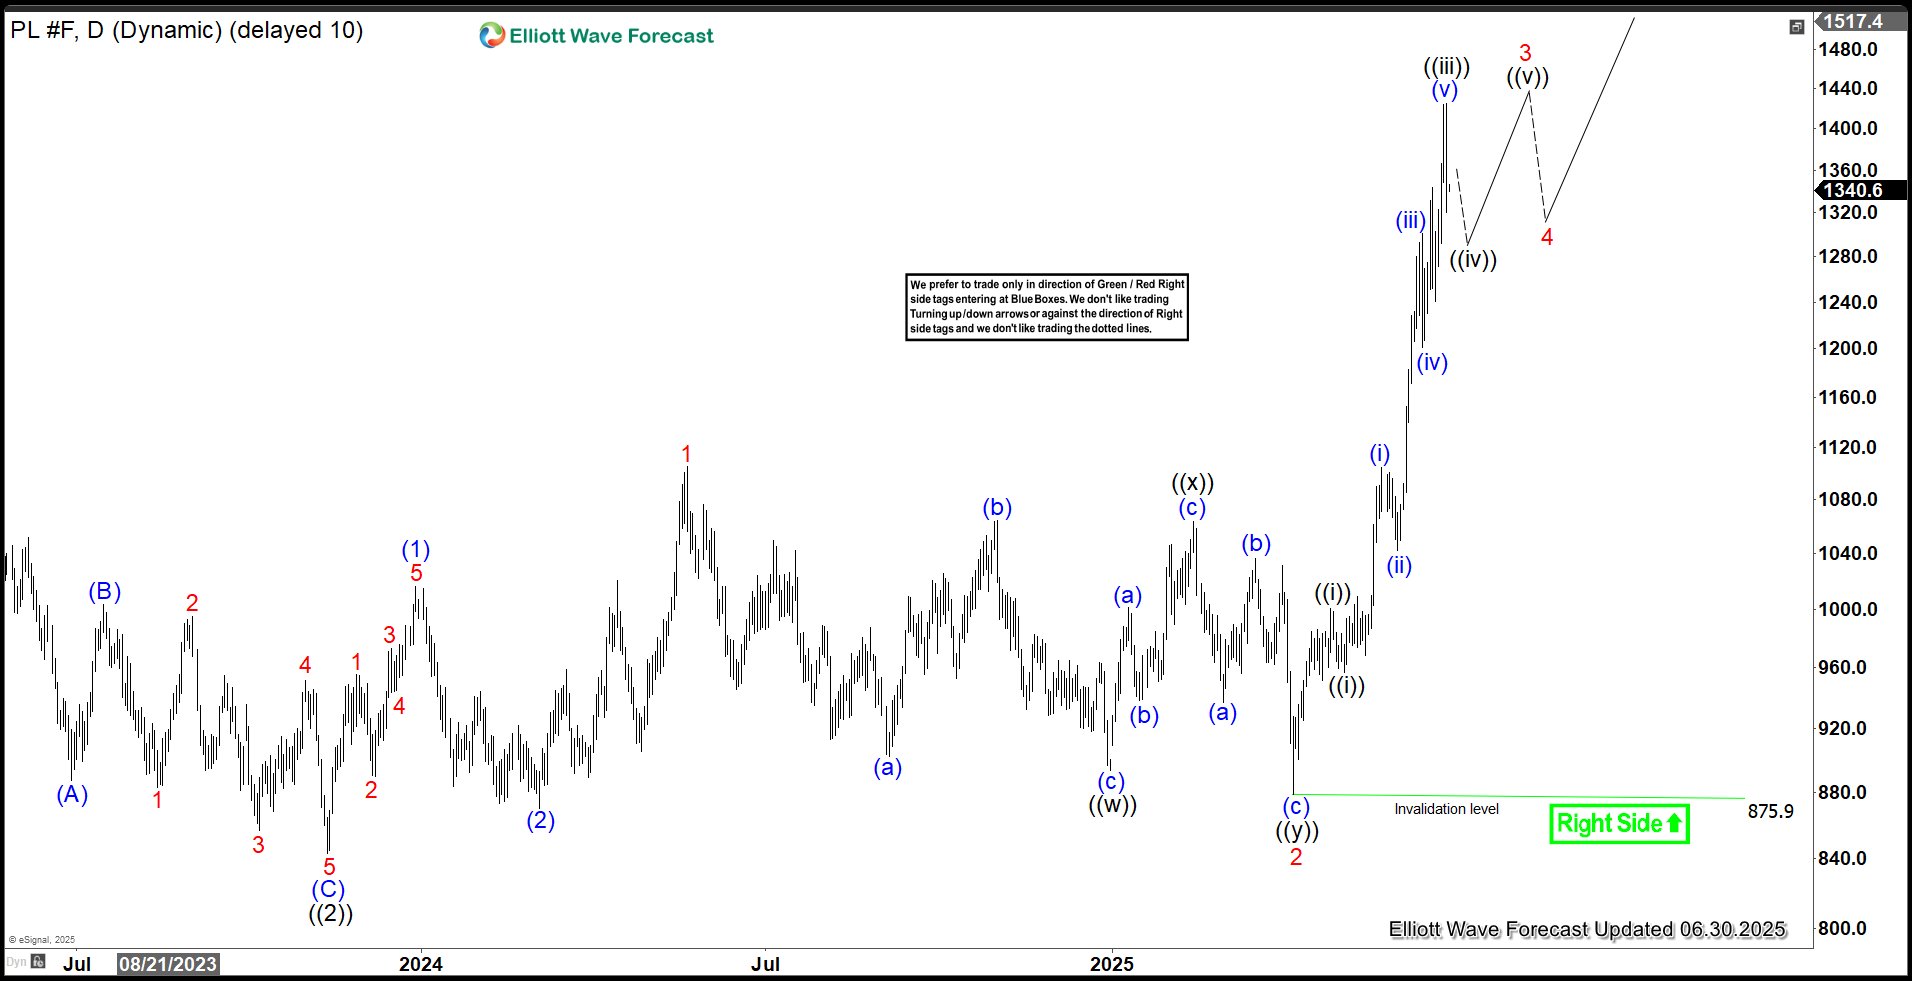
The daily platinum chart indicates that the wave ((2)) pullback concluded at 843.1. From there, wave 1 peaked at 1105, followed by a wave 2 pullback ending at 875.9. The metal has since resumed its ascent in wave 3. In the near term, as long as the price remains above 875.9, expect platinum to continue extending higher.
风险提示:本文所述仅代表作者个人观点,不代表 Followme 的官方立场。Followme 不对内容的准确性、完整性或可靠性作出任何保证,对于基于该内容所采取的任何行为,不承担任何责任,除非另有书面明确说明。

暂无评论,立马抢沙发