


In this blog post, we’ll dive into the recent performance of the YM_F Dow futures, focusing on its 1-Hour Elliott Wave Charts. Since the April 7, 2025, low, the rally has unfolded as an impulse structure. Showing a sequence of higher highs that suggests further upside potential.
Given this momentum, our advice to members has been to avoid selling the index. Instead buy the dips in 3, 7, or 11 swings within the blue box areas. Below, we’ll break down the structure and provide insights into our forecast.
YM_F Dow futures 1-Hour Elliott Wave Chart From 7.15.2025
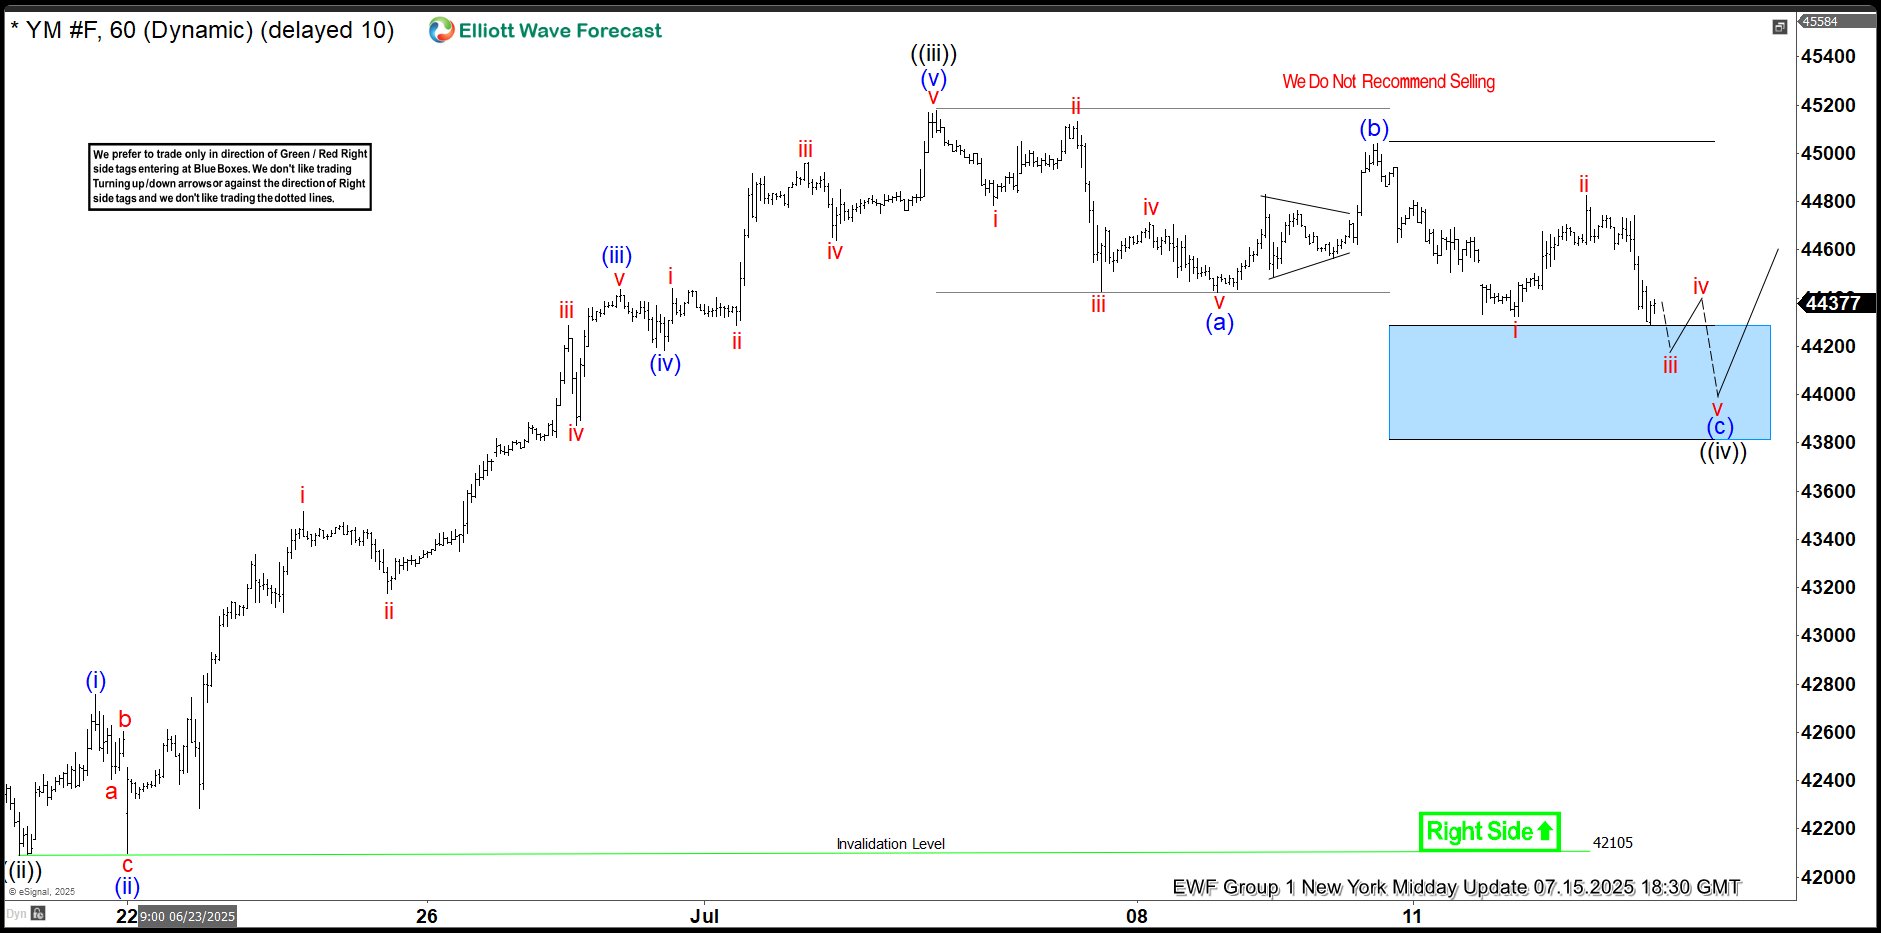 As of our July 15, 2025, NY Midday update, the YM_F Dow futures index had completed the cycle from 6.19.2025 low ended in wave ((iii)) at $45177 high. The subsequent decline unfolded as wave ((iv)), which corrected the preceding cycle. This pullback followed a zigzag structure, with wave (a) ending at $44422 and wave (b) bounce to $45043. Wave (c) then extended to the blue box area $44291- $43819, a zone anticipated for buyer interest, potentially triggering a 3-wave bounce or the next significant leg higher.
YM_F Dow futures Latest 1-Hour Elliott Wave Chart From 7.22.2025
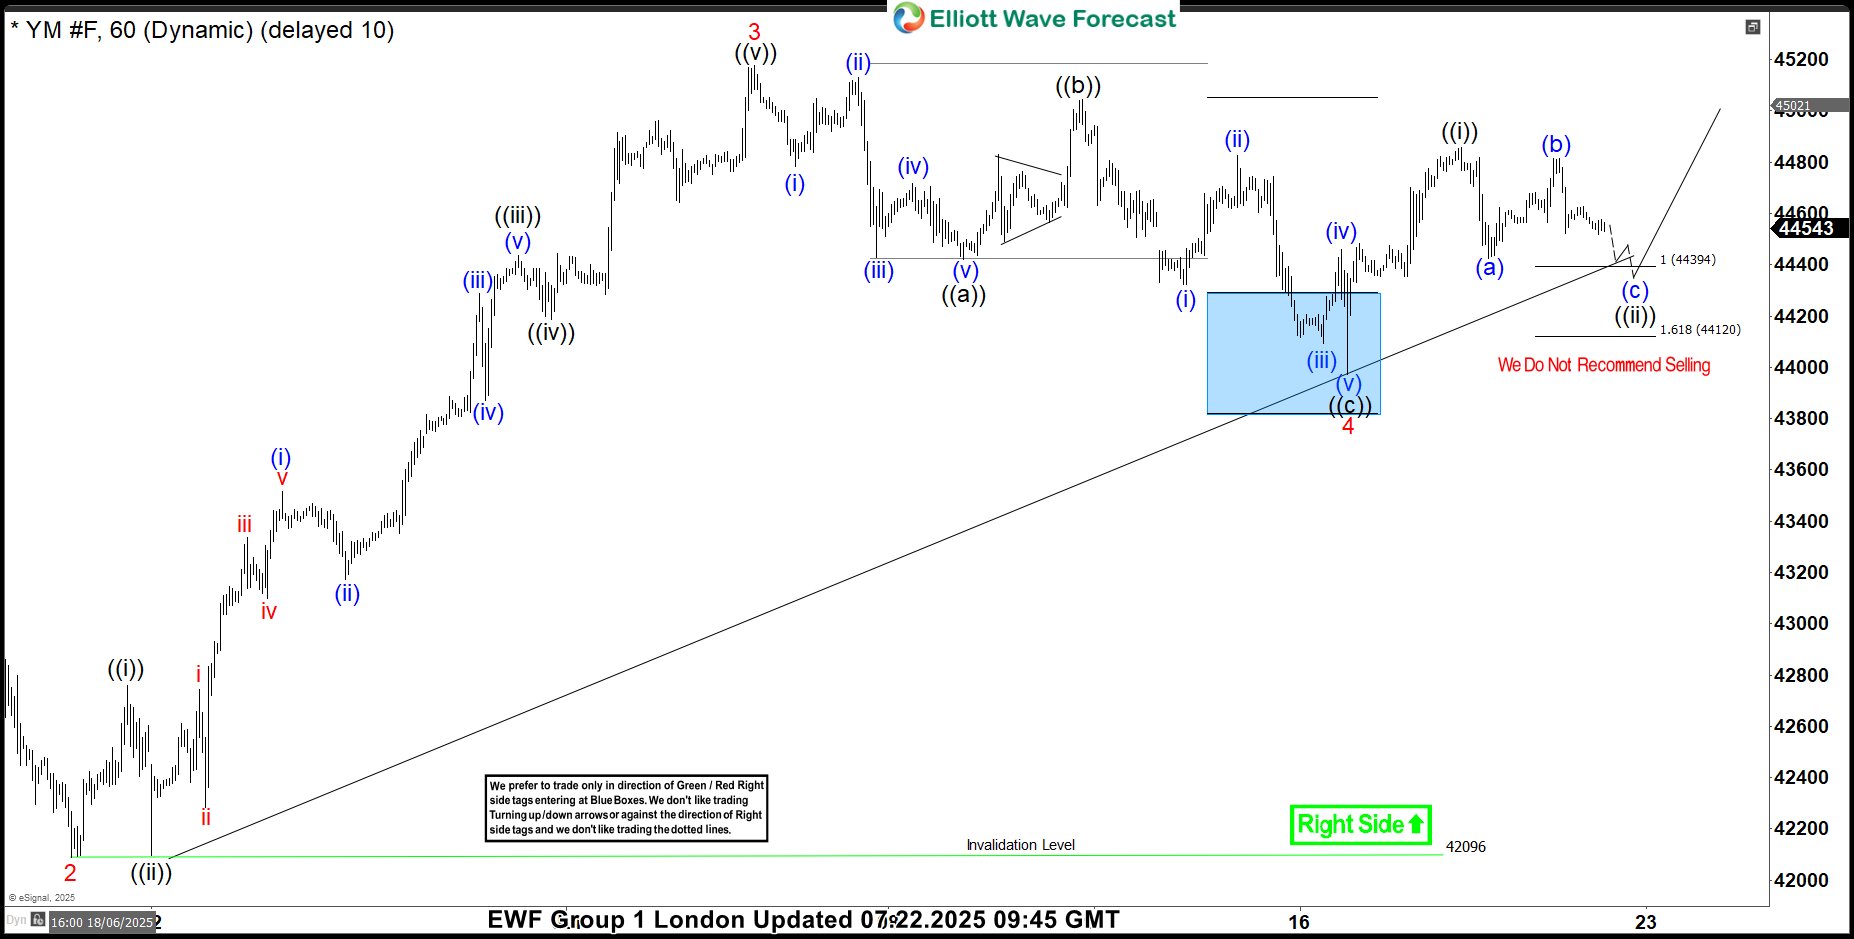
Our latest 1-Hour Elliott Wave Chart update from July 22, 2025, shows the index reacting higher after completing its correction within the blue box area. This favorable move enabled members to secure risk-free positions shortly after entering long at the blue box zone. However, a decisive break above the $45177 high is crucial to confirm further upside potential and prevent a deeper pullback.
风险提示:本文所述仅代表作者个人观点,不代表 Followme 的官方立场。Followme 不对内容的准确性、完整性或可靠性作出任何保证,对于基于该内容所采取的任何行为,不承担任何责任,除非另有书面明确说明。
 暂无评论。 来发表第一条观点吧。