


AIZ maintains the bullish sequence from the March 2020 low. In November, the stock broke a key resistance level and set up new opportunities for buyers from the dip targeting $250 next. This blog post explains the overall view and where buyers could find new entries.
Assurant Inc. (NYSE: AIZ) is a leading global provider of risk management and insurance solutions, serving the housing and lifestyle markets. Headquartered in Atlanta, it operates across Global Housing and Global Lifestyle segments, offering products such as mobile device protection, vehicle service contracts, and renters insurance. With operations in over 20 countries, Assurant partners with major financial institutions and retailers, leveraging data-driven innovation to deliver consistent growth and strong shareholder value.
The all-time bullish cycle for AIZ began in November 2008 at $12.52. From that low, wave (I) ended with an impulse in February 2020 at $146.21. Then, wave (II) pulled back sharply to $76.26 in March 2020. After that, wave (III) is expected to extend toward $287–$417.
Between March 2020 and April 2022, another impulse completed as wave I of (III). Next, wave II pulled back and finished in March 2023. Since the March 2023 low, a clean impulse has developed and pushed price into a new cycle high. The weekly chart from the 28 October update also highlights these sub-waves from the end of wave (II).
In that update, the weekly chart showed a completed impulse for wave ((1)) of III. Afterward, a 7-swing pullback formed wave ((2)) and found buyers in the blue box on the daily chart. With wave ((2)) complete, price extended again and broke above wave ((1)) high. As a result, wave ((3)) is now in progress and can target $330–$380 in the coming weeks or months.
AIZ Elliott Wave Analysis - Daily Chart
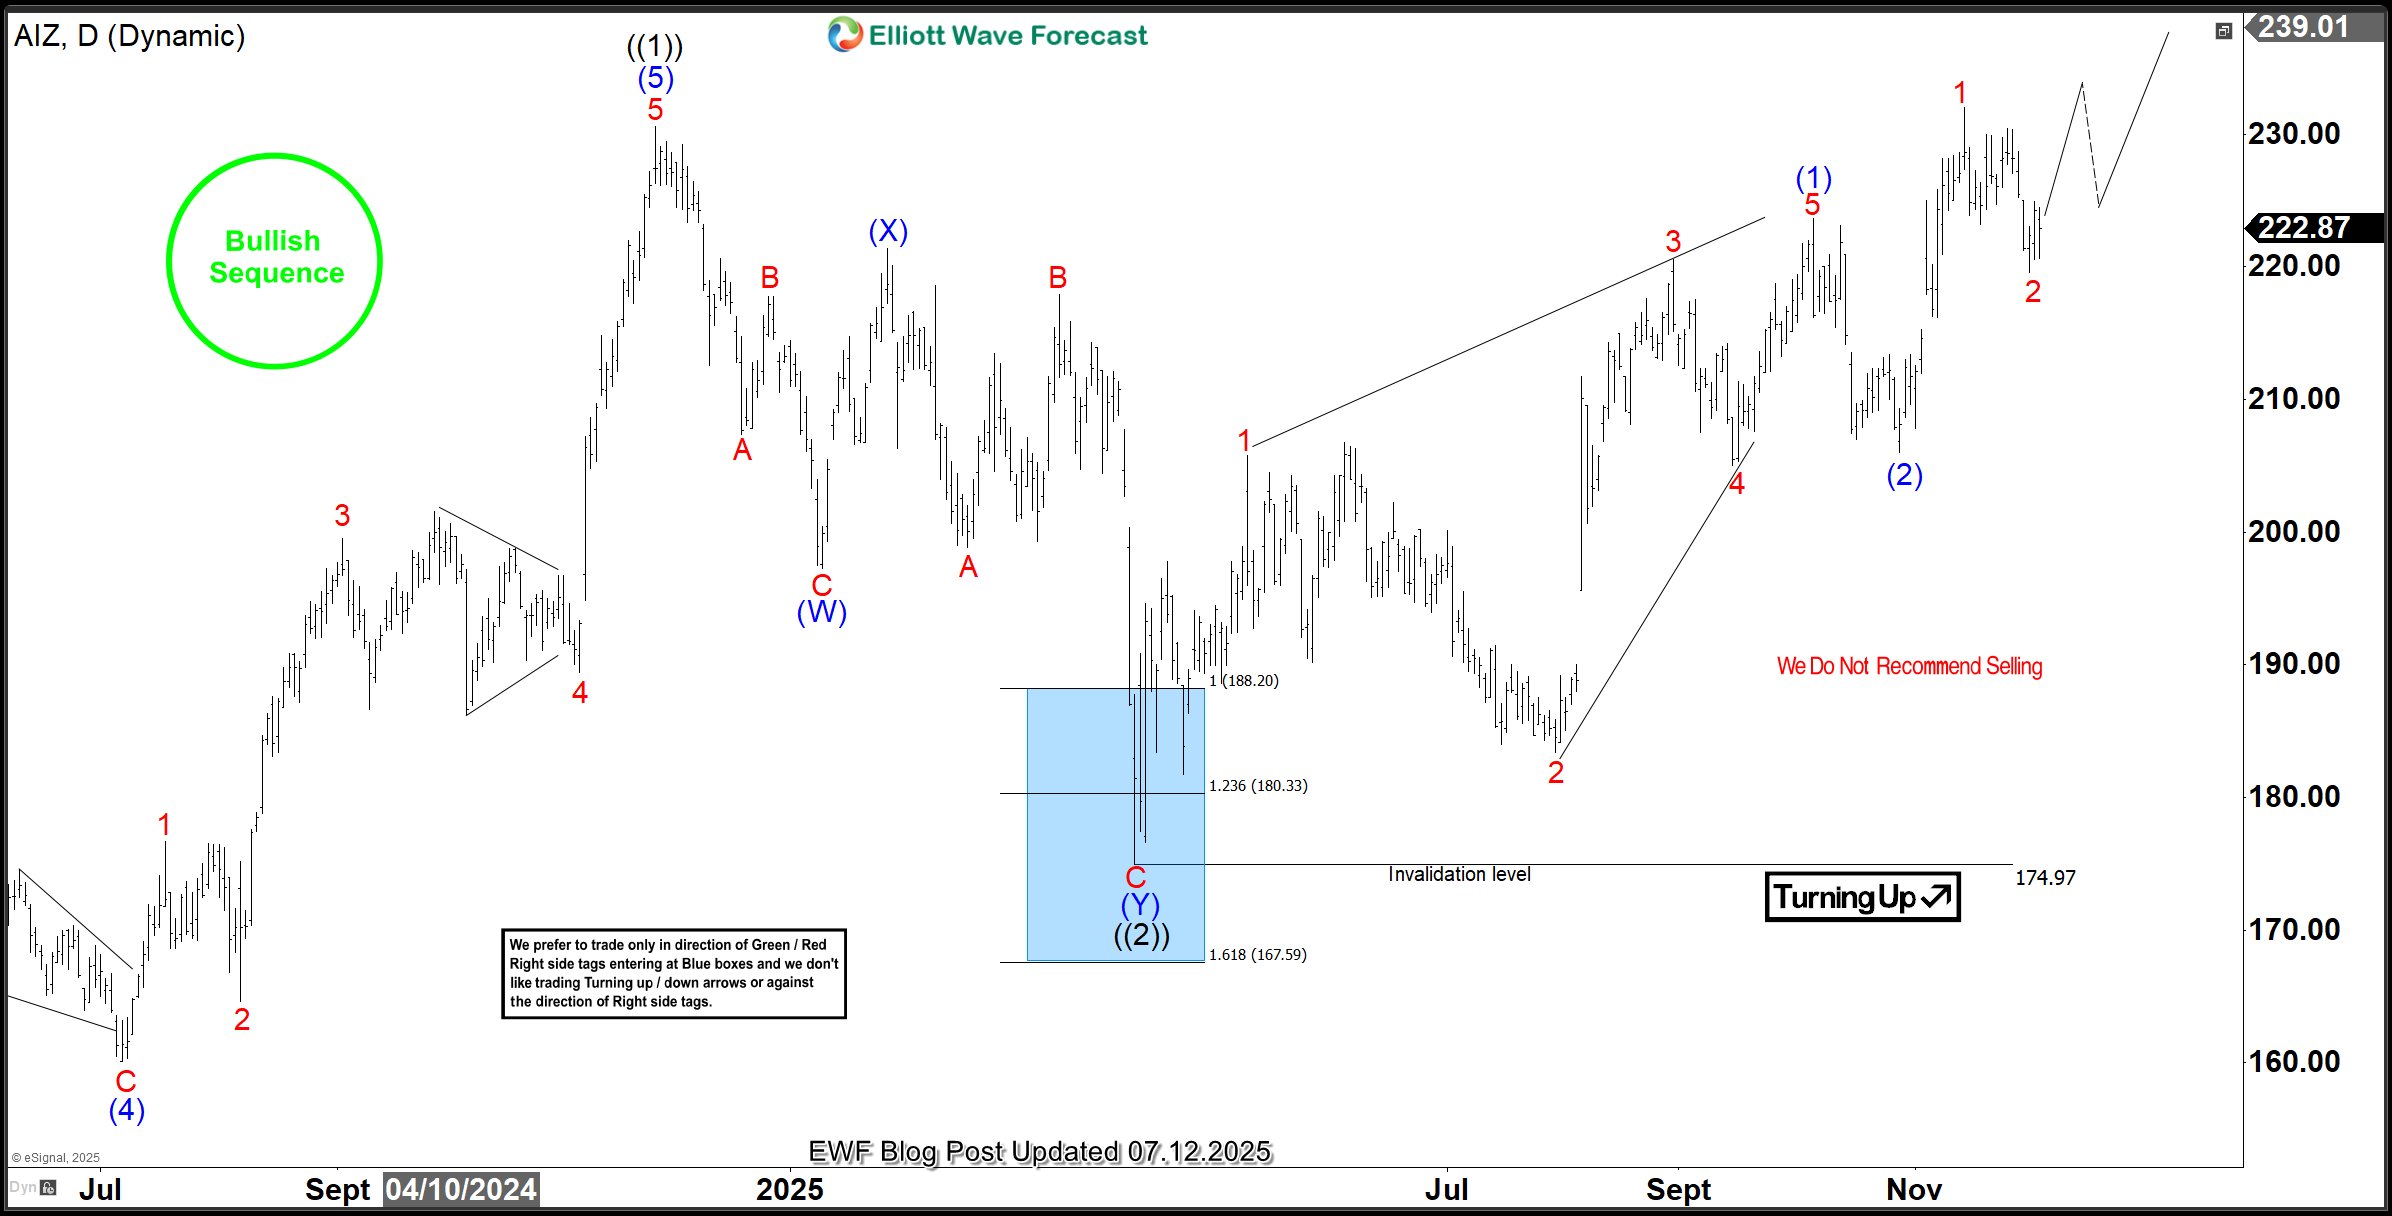
The latest daily chart shows a nest of (1)-(2)-1-2. Price must stay above the 29 October 2025 low to extend higher. The top of wave 1 not only broke the 1) high, but also cleared the ((1)) top. Therefore, traders should buy dips from a 3-, 7-, or 11-swing extreme, as the H4 chart indicates.
AIZ Elliott Wave Analysis - H4 Chart
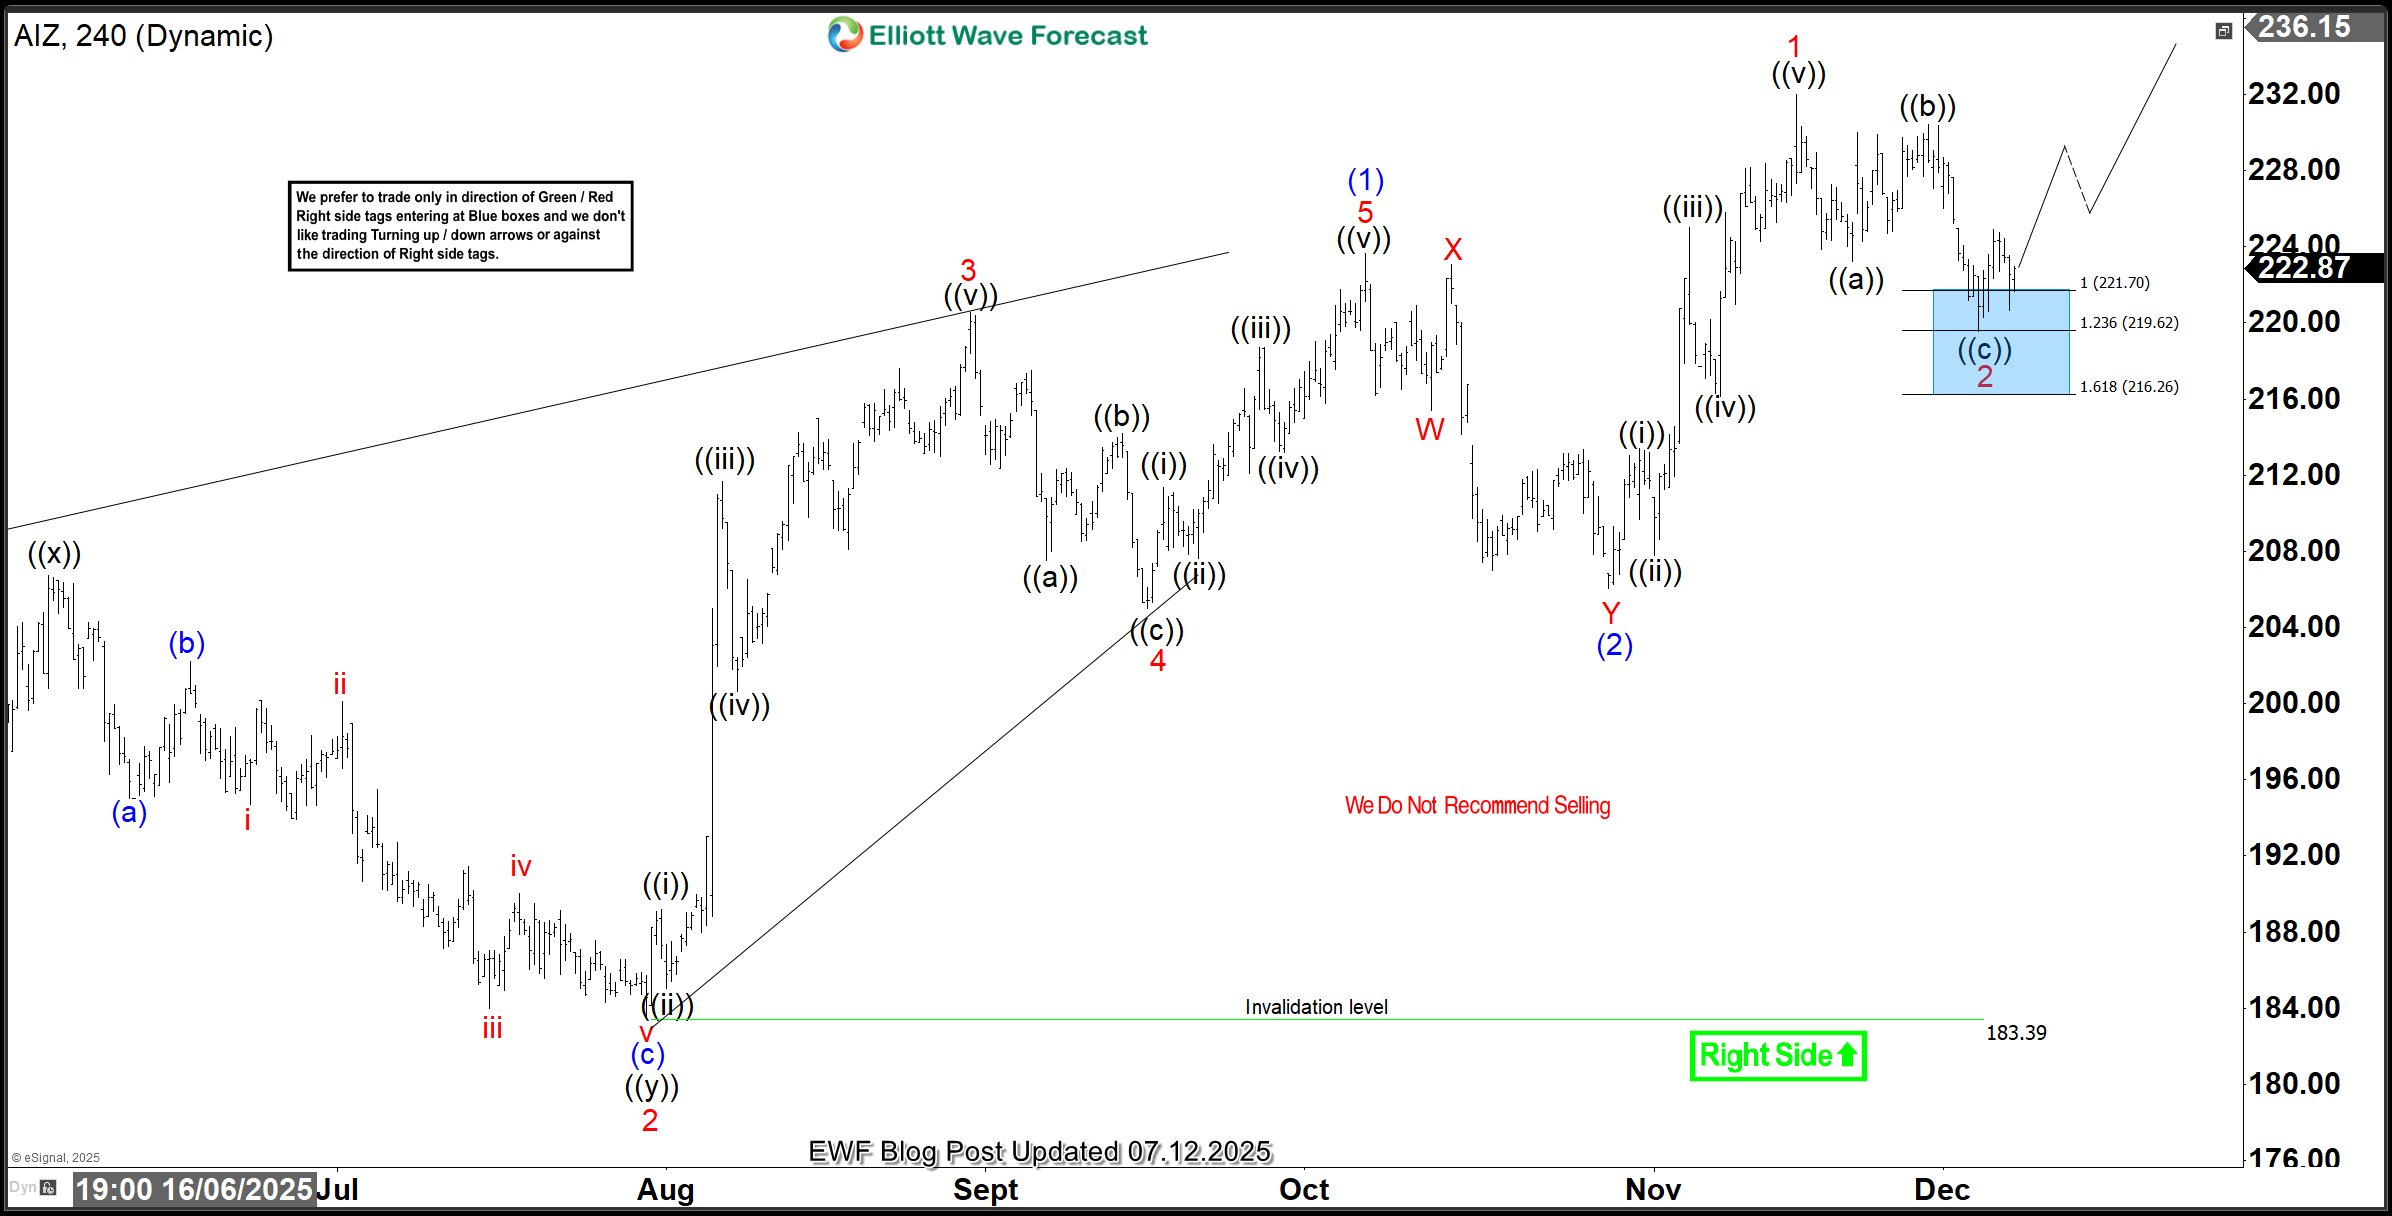
On the H4 chart, price corrected wave 1 in wave 2 with a 3-swing pullback. At the blue box zone of 221.7–216.26, the stock attracted fresh buyers. Price should reach at least 225, allowing traders to take partial profits and move stops to breakeven.
Looking ahead, price may complete a 5-wave advance to form wave 3. Alternatively, it may form a 3-swing bounce below the 13 November high and then drop into a 7-swing pullback for a deeper wave 2. In both scenarios, traders must stay ready. We always prepare members for such paths. As long as the stock holds its bullish sequence, it will keep attracting buyers from the blue box area.
风险提示:本文所述仅代表作者个人观点,不代表 Followme 的官方立场。Followme 不对内容的准确性、完整性或可靠性作出任何保证,对于基于该内容所采取的任何行为,不承担任何责任,除非另有书面明确说明。
 暂无评论。 来发表第一条观点吧。