


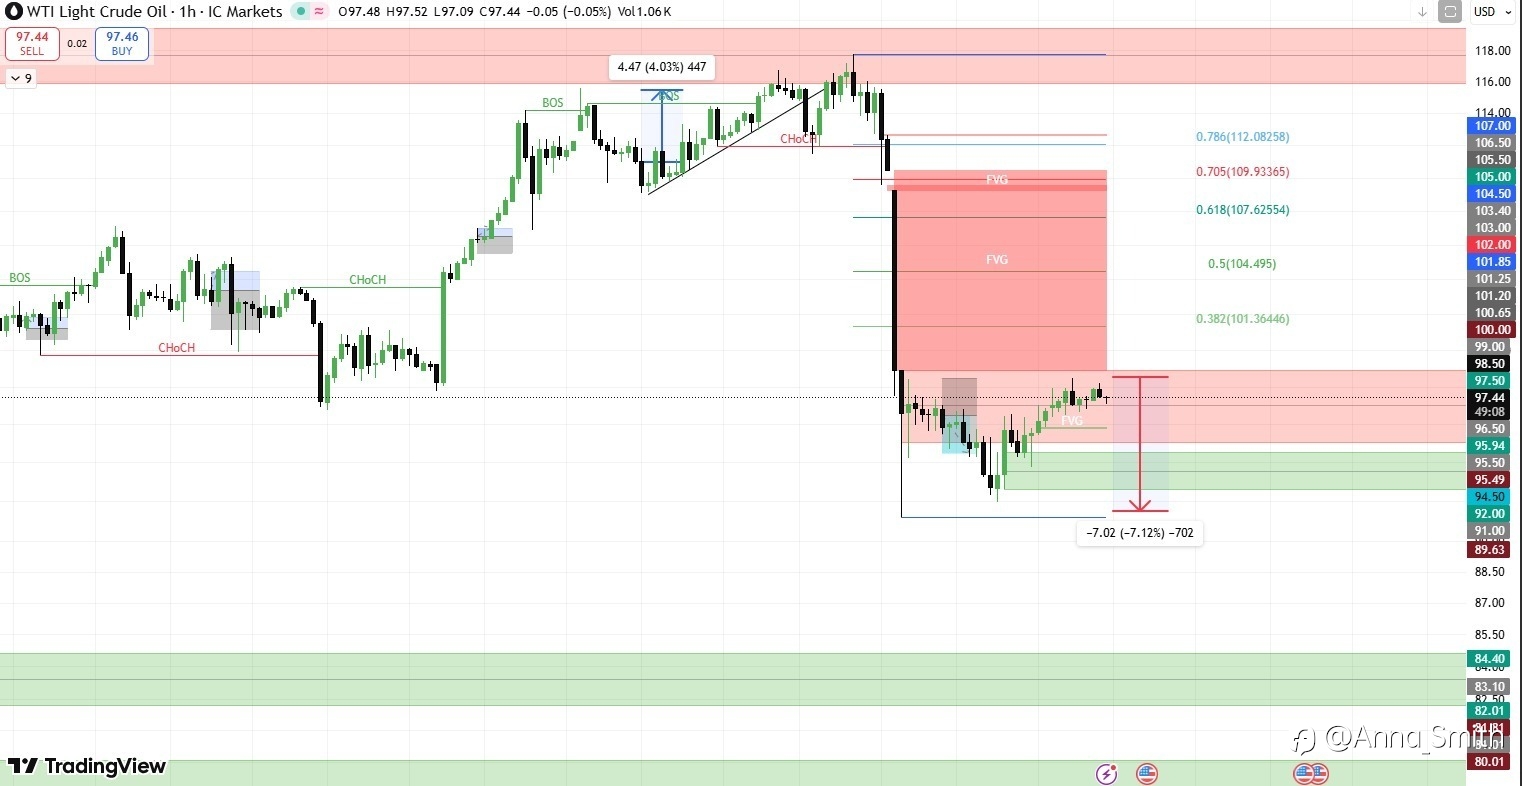
WTI just had a pretty strong sell-off, and the move down was fast and aggressive. When the market drops like that, it usually leaves some imbalances (FVGs) behind, which often pull price back before the next move.
Right now price seems to be stabilizing around the 95–97 area, but there’s still a noticeable imbalance above that could attract a pullback if buyers step in.
What I’m watching right now:
• A possible retracement into the FVG / supply area where sellers might step in again.
• Or if the bearish momentum continues, we could see another move down toward the 94–92 zone.
Moves like this rarely go straight in one direction, so a bounce before the next leg wouldn’t be surprising.
Just sharing my perspective on the chart — always interesting to hear how others are reading it.
What do you think?
Do you expect a pullback first, or more downside from here?
If you enjoy simple chart breakdowns like this, feel free to follow my profile. I share trading ideas and market observations regularly.
风险提示:本文所述仅代表作者个人观点,不代表 Followme 的官方立场。Followme 不对内容的准确性、完整性或可靠性作出任何保证,对于基于该内容所采取的任何行为,不承担任何责任,除非另有书面明确说明。
 暂无评论。 来发表第一条观点吧。