Mastercard Inc (NYSE: MA) is undergoing a weekly correction. Today, we dive into its technical chart. Our analysis explores the Elliott Wave structure and projected target for the current cycle.
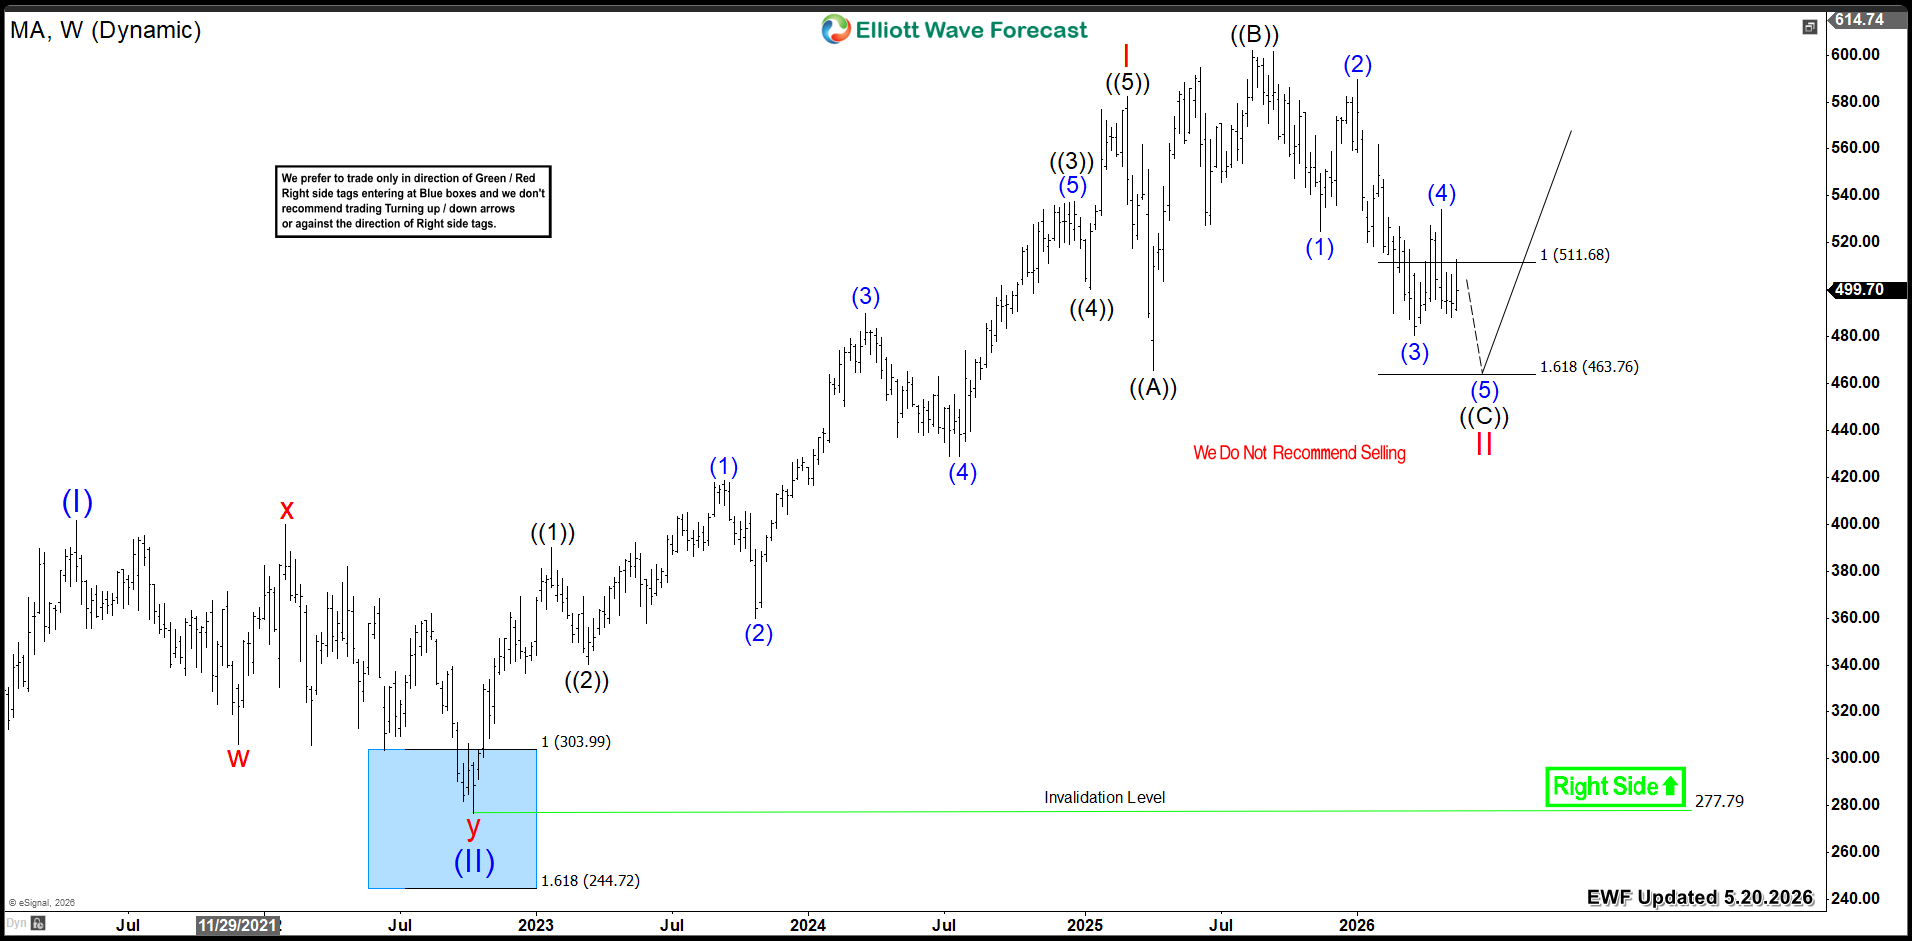
MA completed an impulsive five-wave advance from its 2022 low of 277.79. Wave I peaked at $582. From that high, a three-wave flat correction is now unfolding. Wave ((A)) ended at 465. Then, Then, wave ((B)) reached $601. Currently, wave ((C)) remains in progress.
The stock already reached the equal legs zone ( $511 − $463) . This area should conclude wave II. Consequently, a bullish reversal will take place from this zone and Mastercard will look to resume the rally higher in wave III into new all time highs.
Mastercard (MA) Weekly Chart 5.20.2026
Conclusion
Mastercard's (MA) bullish cycle remains in progress. The stock is poised for further upside extension. Therefore, investors should target buying opportunities within weekly pullbacks.
风险提示:本文所述仅代表作者个人观点,不代表 Followme 的官方立场。Followme 不对内容的准确性、完整性或可靠性作出任何保证,对于基于该内容所采取的任何行为,不承担任何责任,除非另有书面明确说明。

暂无评论,立马抢沙发