AST SpaceMobile, Inc., (ASTS) together with its subsidiaries designs & develops the constellation of BlueBird Satellites in the United States. The company provides a cellular broadband network in space to be accessible directly by smartphones for commercial use & other applications for government use. It comes under Technology sector & trades as “ASTS” at Nasdaq.
ASTS favors bullish sequence in weekly started from 4.02.2024 low. It ended (I) at $129.89 high (1.30.2026) & (II) at $63.13 low (5.05.2026). The buyers are looking for pullback into Blue box area for another long set up against May-2026 low.
It made all time low of $1.97 in April-2024 low. Above there, it ended I of (I) at $39.08 high, II at $17.50 low, III at $102.79 high, IV at $49.31 low & V at $129.89 high. Within III, it ended ((1)) at $33.55 high, ((2)) as flat at $18.22 low, ((3)) at $60.95 high, ((4)) at $36.08 low & ((5)) at $102.79 high. Within V, it ended ((1)) at $85.45 high, ((2)) at $61.40 low, ((3)) at $120.80 high, ((4)) at $96.93 low & ((5)) at $129.89 high. Below (I) high, it ended w at $77.17 low, x at $104.15 high as flat & y at $63.13 low in (II) double correction.
ASTS - Elliott Wave Latest Daily View: 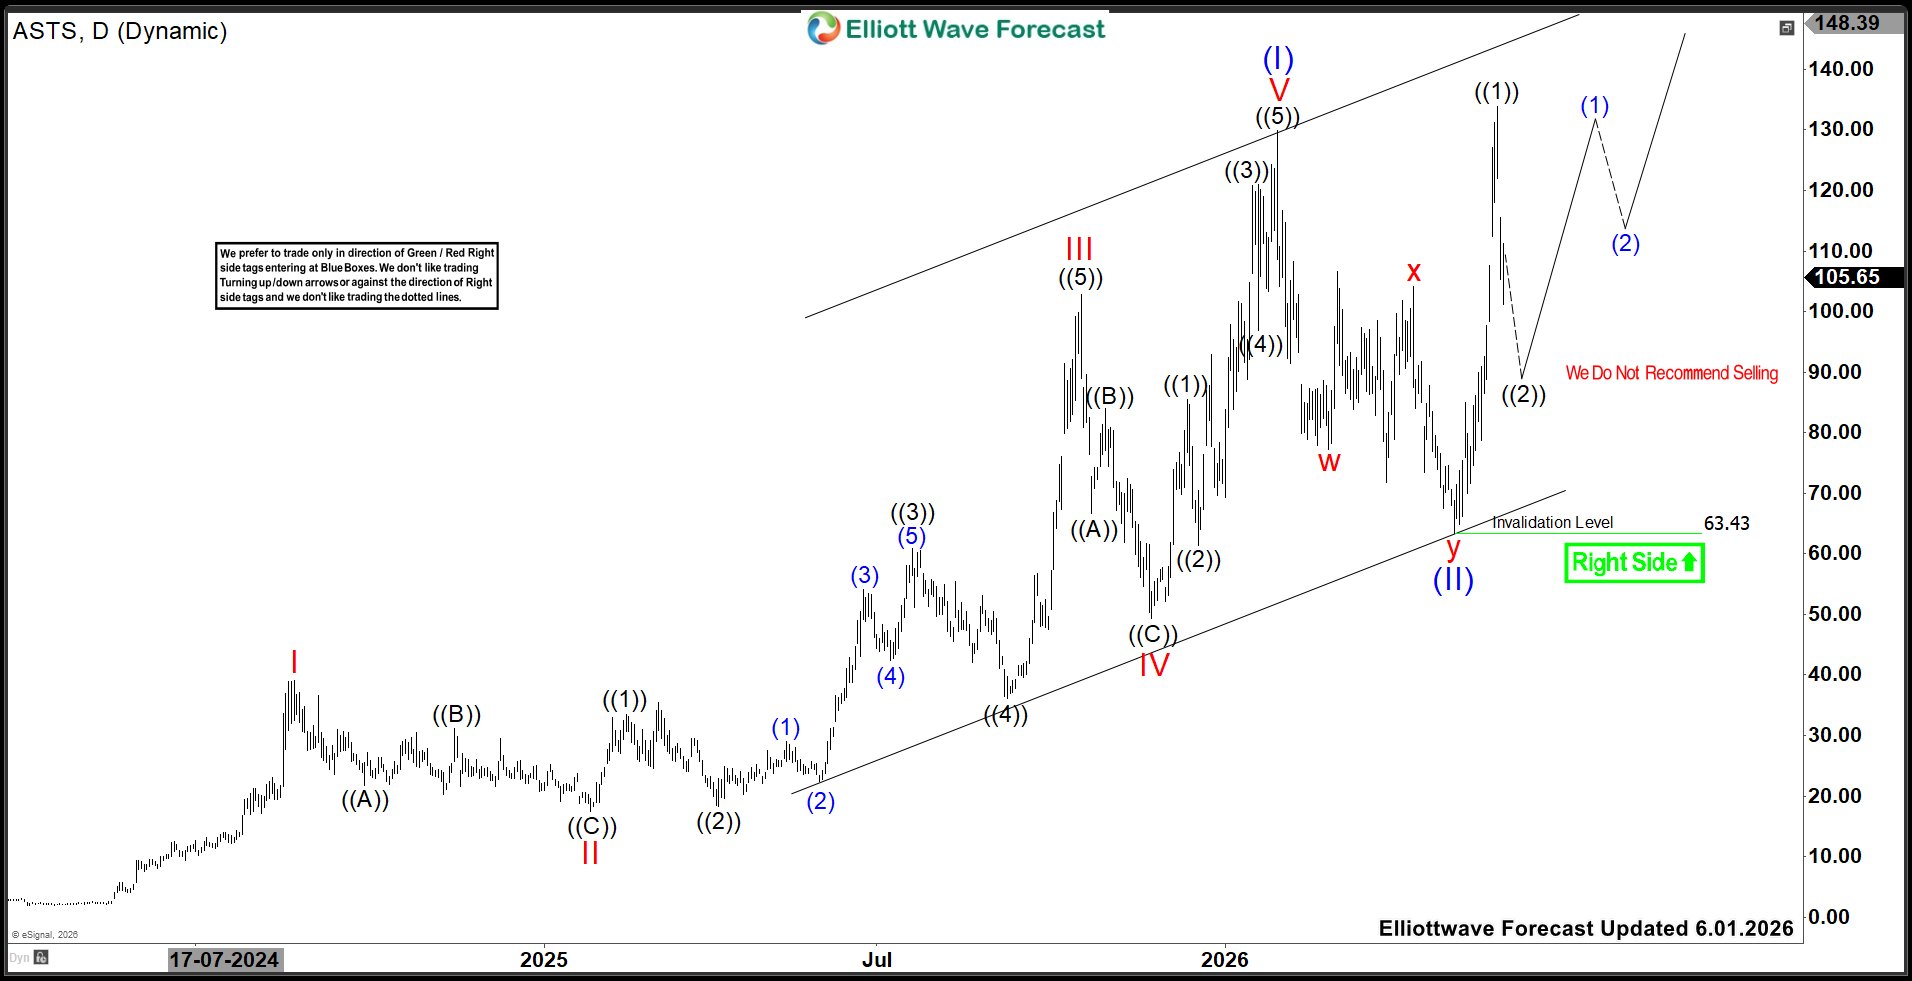
Above (II) low, it ended ((1)) of I of (III) at $133.80 high & favors ((2)) correction against 5.05.2026 low. It ended (1) of ((1)) at $75 high, (2) at $64.91 low, (3) at $131.20 high, (4) at $121.05 low & (5) at $133.80 high. Below ((1)) peak, it proposed ended (A) at $105.37 low & (B) at $115.50 high. As long as the bounce fail below $115.50 high, it expects (C) to extend toward $87.04 - $69.44 area to end ((2)) correction. Buyers can enter that area for next leg higher.
ASTS - Elliott Wave Latest 2-hour View: 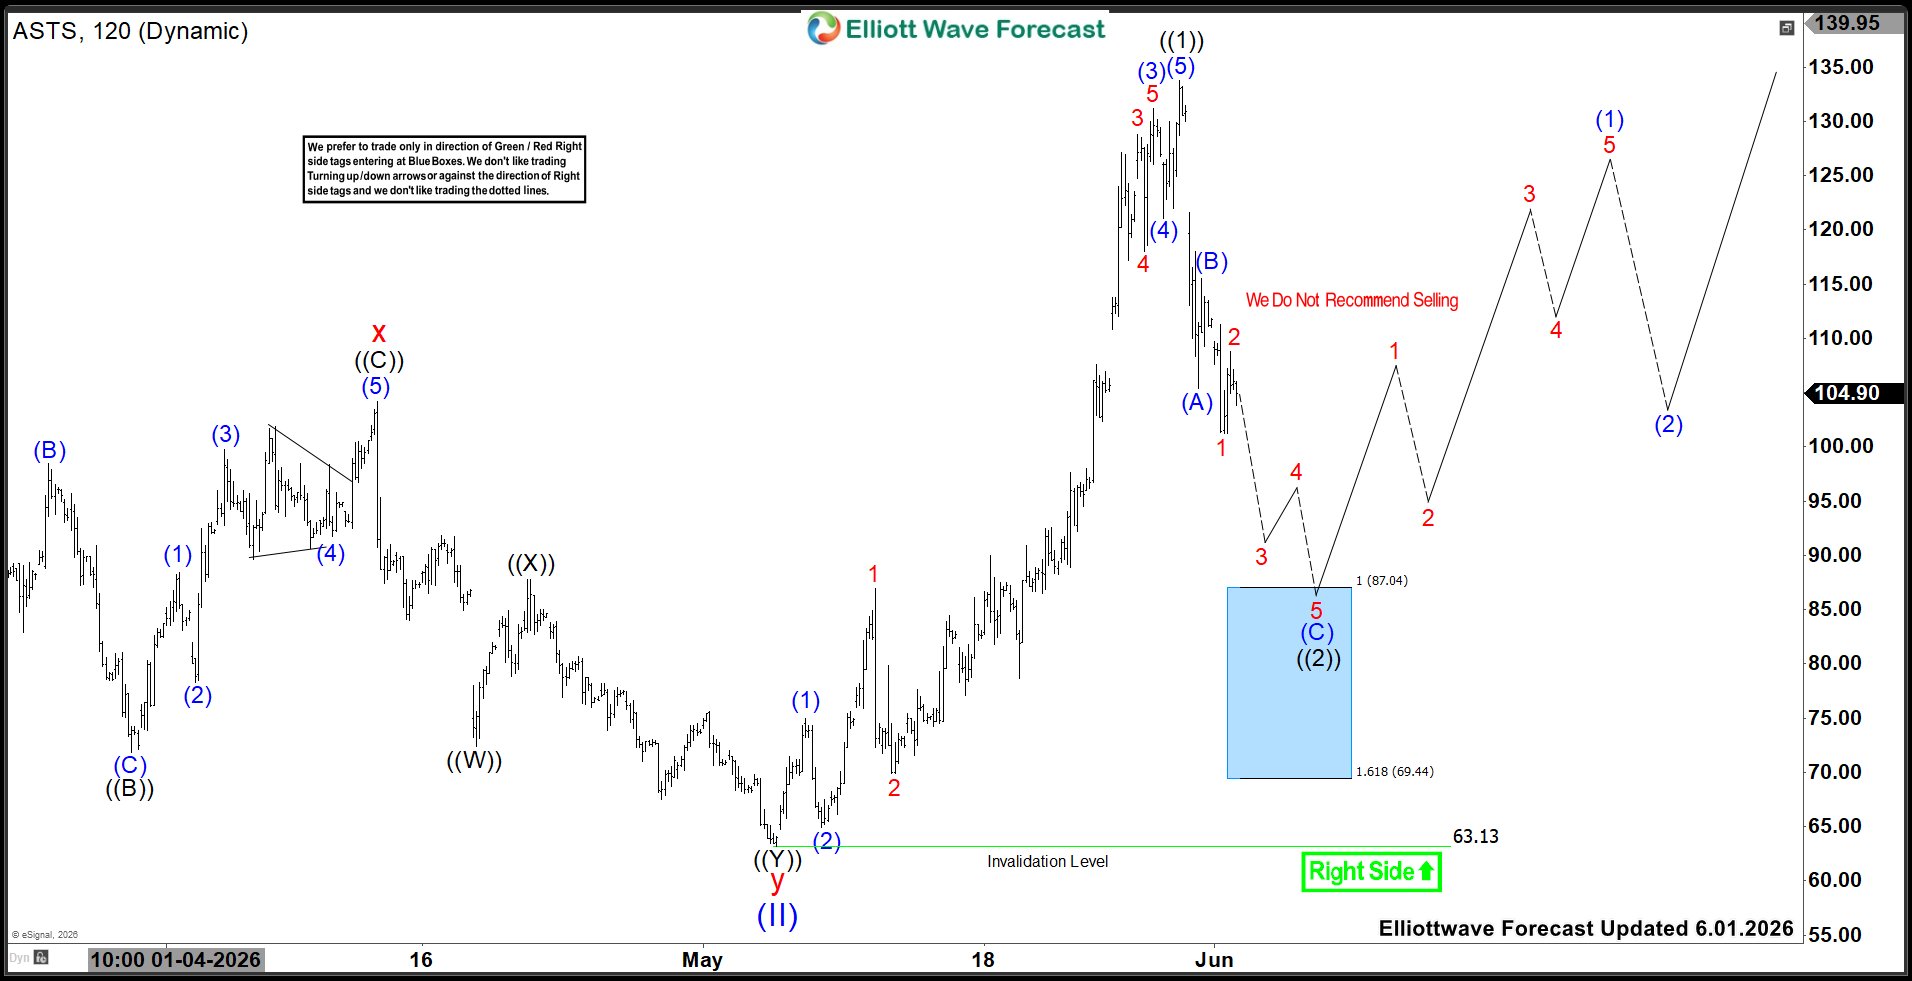
There are few possible alternates in ((2)) correction. (1) If it makes a minor low and bounce later to break above $108.75 high. Then it can be (B) bounce, while low will be (A). In that case, it can see another push lower later in (C) to end ((2)). (2) If it breaks above $115.50 high without further extension lower, then it can be truncated in (C) & continue higher in ((3)), which confirms above $133.80 high to rule out double correction.
风险提示:本文所述仅代表作者个人观点,不代表 Followme 的官方立场。Followme 不对内容的准确性、完整性或可靠性作出任何保证,对于基于该内容所采取的任何行为,不承担任何责任,除非另有书面明确说明。

暂无评论,立马抢沙发