


Astera Lab, ALAB, is retreating after over 340% gain between April and June 2026. How deep can the pullback go before the stock enters the next bullish phase?
Astera Labs is a semiconductor company that builds high-speed connectivity chips and software for AI and cloud data centers. Its products help CPUs, GPUs, memory, and networks communicate faster and more efficiently, making large AI systems and data centers perform better. Founded in 2017 and headquartered in San Jose, California, Astera Labs is a key beneficiary of the growing demand for AI infrastructure.
ALAB Elliott Wave Analysis - Daily Chart
The stock launched its IPO on 19th March 2024 at $36 per share. It got listed on 20th March 2024 with a ticker ALAB (NASDAQ) and immediately traded at $50.6 before jumping to $95.2 about a month after. However, from that top it dropped gradually in nearly 5-month period hit it's lowest price of $36.2. From that low, it never looked back. Thus, the Elliott wave forecast in this post starts from the low of August 2024.
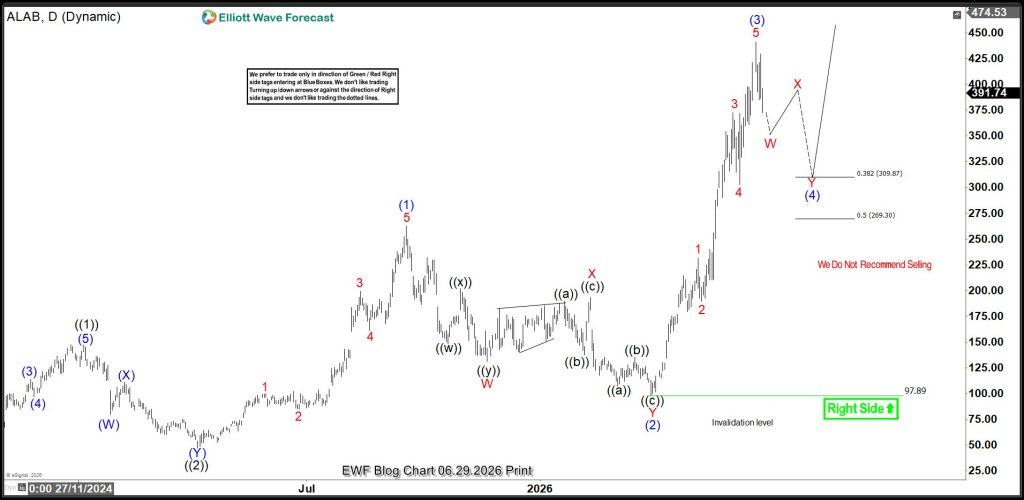
ALAB started the first bullish cycle from the all-time low to $147 on 6th January 2025 where it completed wave ((1)). Wave ((1)) completed a clear impulse wave structure. From the top of ((1)), wave ((2)) began and completed a double zigzag structure at the low of $47 on 4th April 2025. From the 4th April 2025 low, the 3rd swing started and completed an impulse wave structure on 18th September 2025 at $244 before the 4th swing followed with a double zigzag structure that ended on 30th March 2026.
However, the 4th swing entered into the territory of the 1st swing. Thus, it can't be the 4th wave of a larger degree impulse eave structure. As a result, we can consider a nest of ((1))-((2))-(1)-(2) leading to a strong impulse wave sequence in the primary degree. Wave (2) of ((3)) ended at 97.89. From the early looks, it appears wave ((3)) will be extended. One of the guidelines of the Elliott wave theory is that one of the 1st, 3rd or 5th wave of an impulse structure will be extended.
The biggest surge since inception followed and reached a record high of $421. This surge could be wave (3) as it's strong and fast. Thus, the pullback emerging can easily be wave (4) of ((3)). By Fibonacci projection, wave (4) could extend to 309.87-269.30 before the next bullish phase begins. Thus, at the extreme of wave (4) buyers will have find trade opportunities again.
ALAB Elliott Wave Analysis - Daily Chart - ALTERNATIVE COUNT
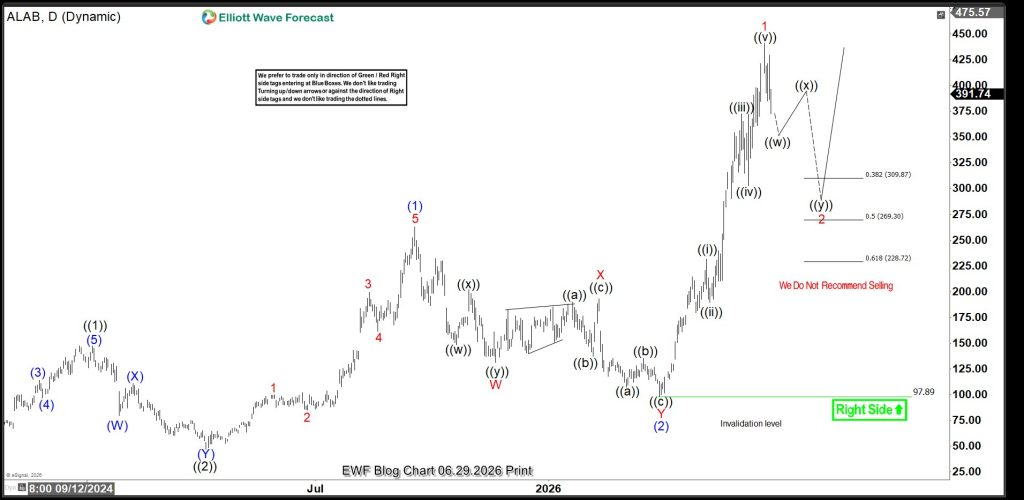
In case the pullbacks gets very deep below $269, the above chart shows the alternative. This means, the nesting will extend to the minor degree. Thus, the current pullback will be wave 2 of (3) of ((3)). This scenario suggests a more extended waves ((3)) and (3) than the first count. However, the implications are similar for both count. Buyers should focus on the pullback from June 22, 2026 top and buy at the extreme if it completes a 3, 7 or 11 swing structure.
风险提示:本文所述仅代表作者个人观点,不代表 Followme 的官方立场。Followme 不对内容的准确性、完整性或可靠性作出任何保证,对于基于该内容所采取的任何行为,不承担任何责任,除非另有书面明确说明。
 暂无评论。 来发表第一条观点吧。