


SHOP may face mixed momentum next quarter as revenue trends stabilize and margins tighten. Investors will watch subscription growth and enterprise adoption because these segments drive recurring cash flow. Management guidance will matter, especially if it signals stronger demand or slower consumer spending. Traders should expect higher volatility as markets react to earnings revisions and macro data.
It holds a complex structure after weeks of tight consolidation. Price respects dynamic support and reacts near institutional zones. Bulls need a decisive close above resistance to confirm momentum. A break below support could trigger fast corrective waves. Volatility remains muted, yet it can expand with fresh catalysts.
Elliott Wave Outlook: SHOP Daily Chart April 2026
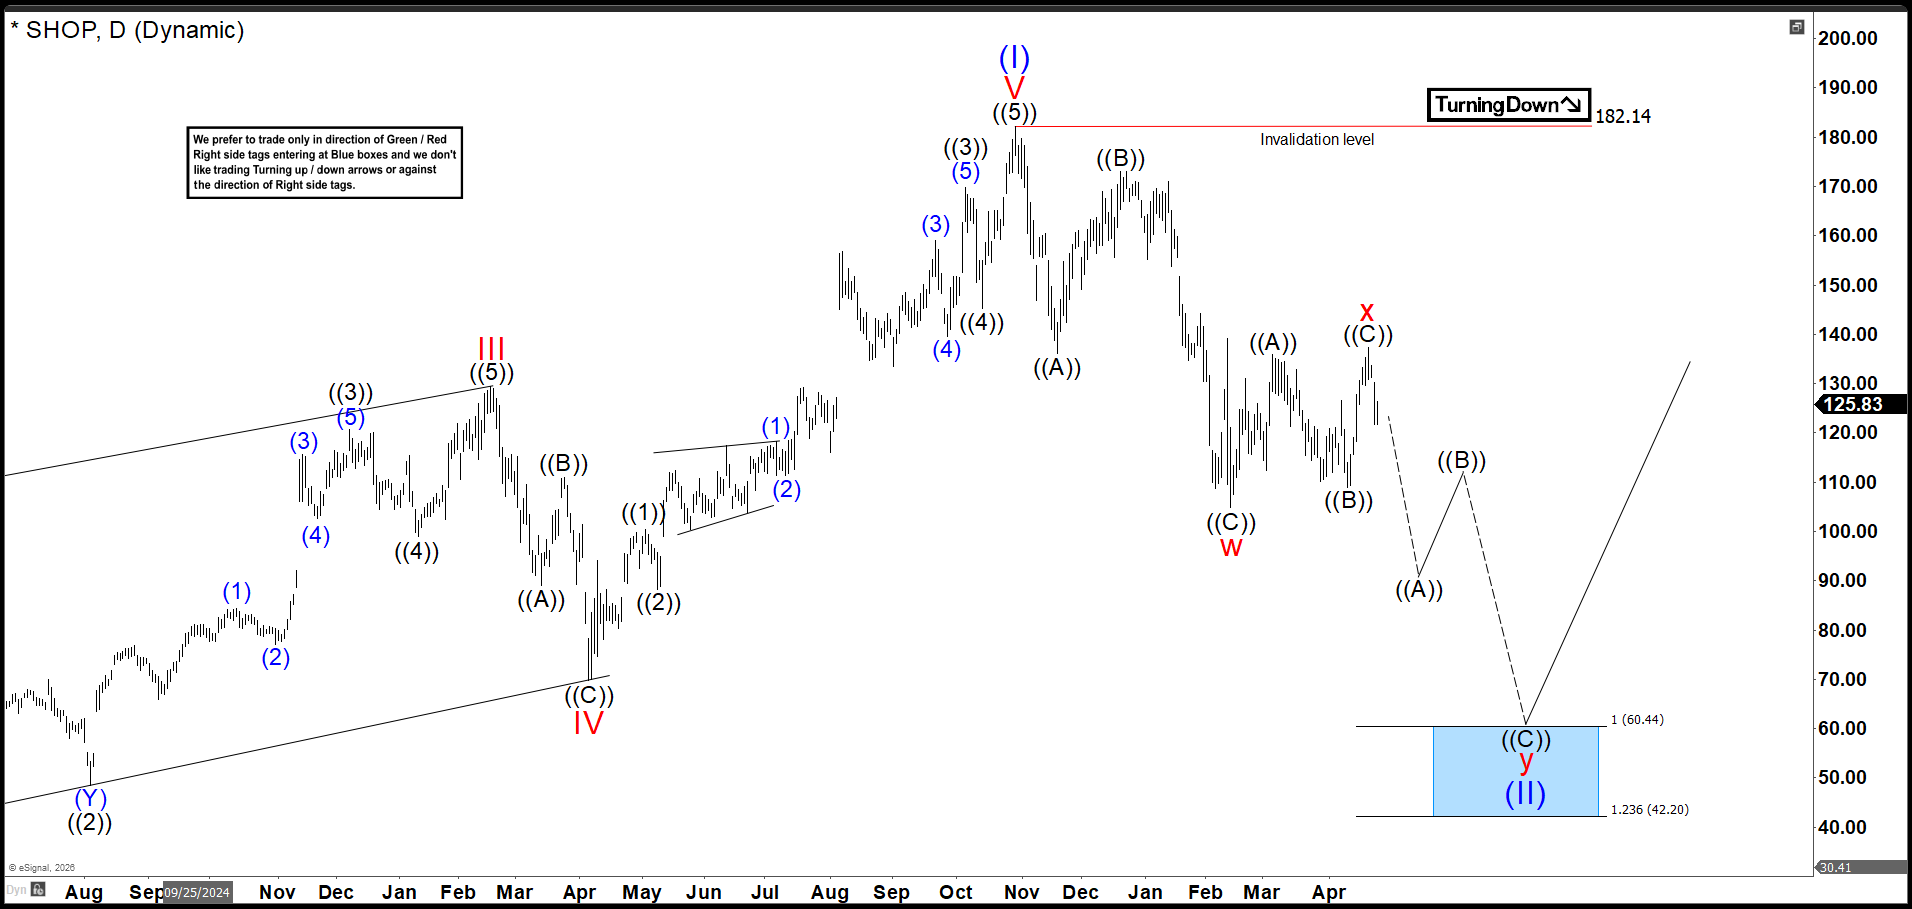
Back in April chart, SHOP delivered a final rally toward 182.69 and completed wave (I). Then price action printed three waves down as wave w and tried a bullish bounce. However, the rebound showed weak traction, so we expected a double correction as wave (II). To confirm that view, price needed to break the February low and stay below it. That move would validate the double correction toward 60.44–42.20. Still, we watched the 104.92 level because a break with lagging price could create a truncated correction. In that case, SHOP could resume the rally from the 90.00–70.00 zone. Therefore, price behavior after losing 104.92 became extremely important for the next cycle.
Elliott Wave Principle Behind the Market Structure
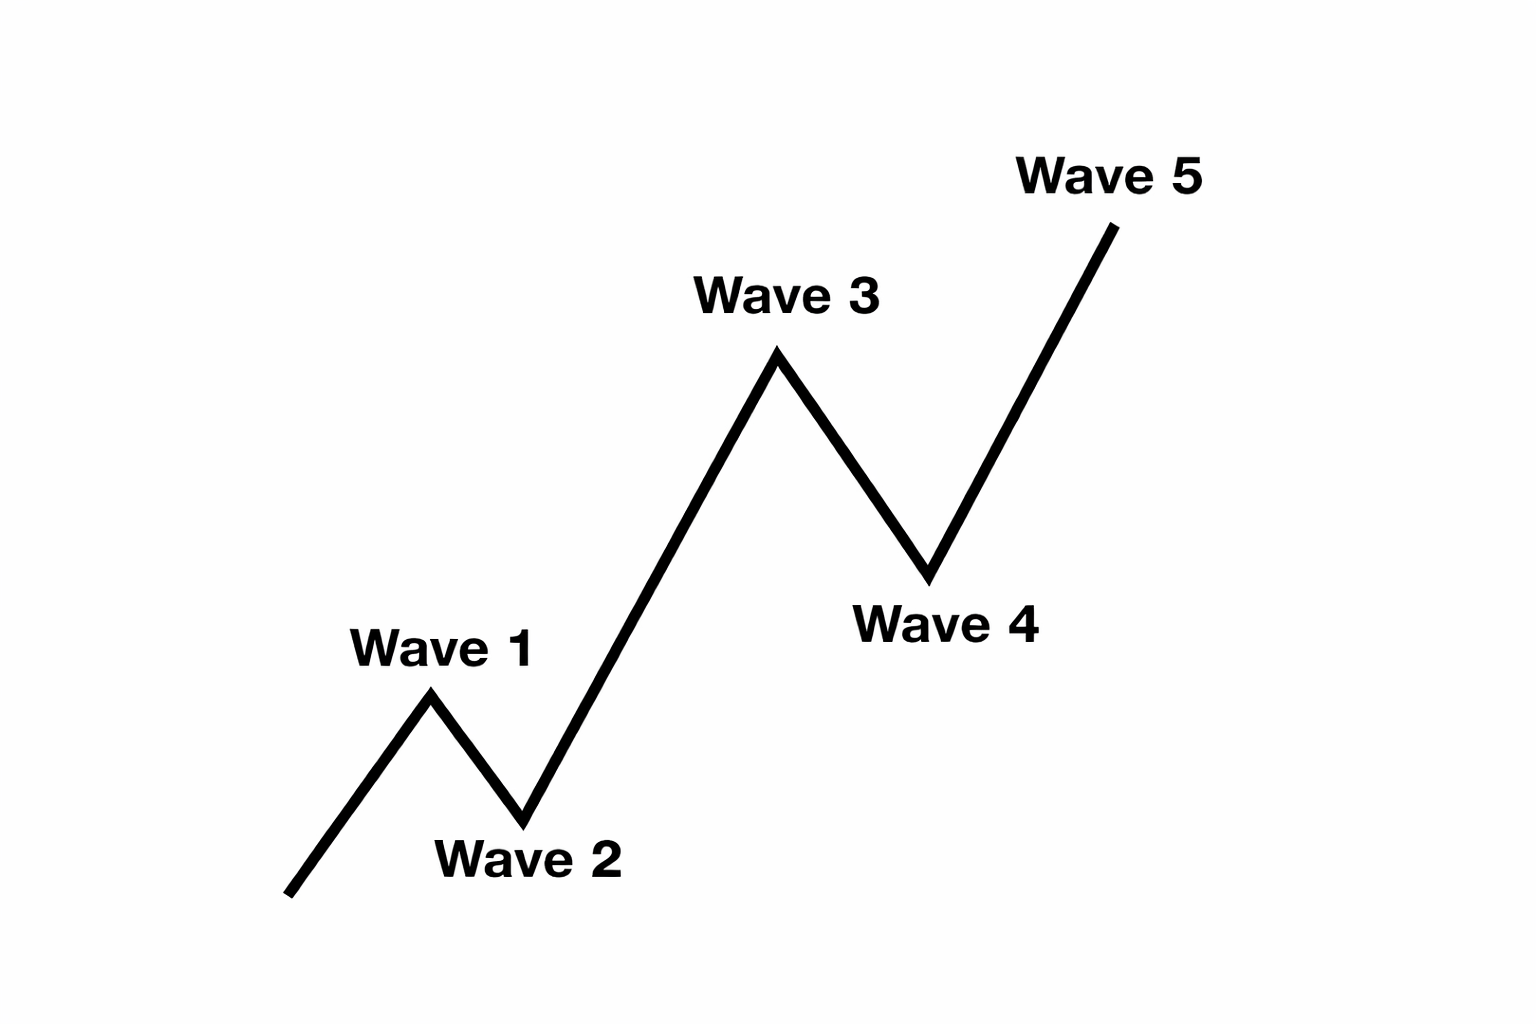
Impulse
An impulse is a clean 5‑wave pattern that drives the trend forward.
- Waves 1‑3‑5 are strong and directional.
- No overlap between waves 1 and 4.
- Wave 3 is usually the strongest.
- Structure is clear, with increasing momentum.
Elliott Wave Outlook: SHOP Daily Chart July 2026
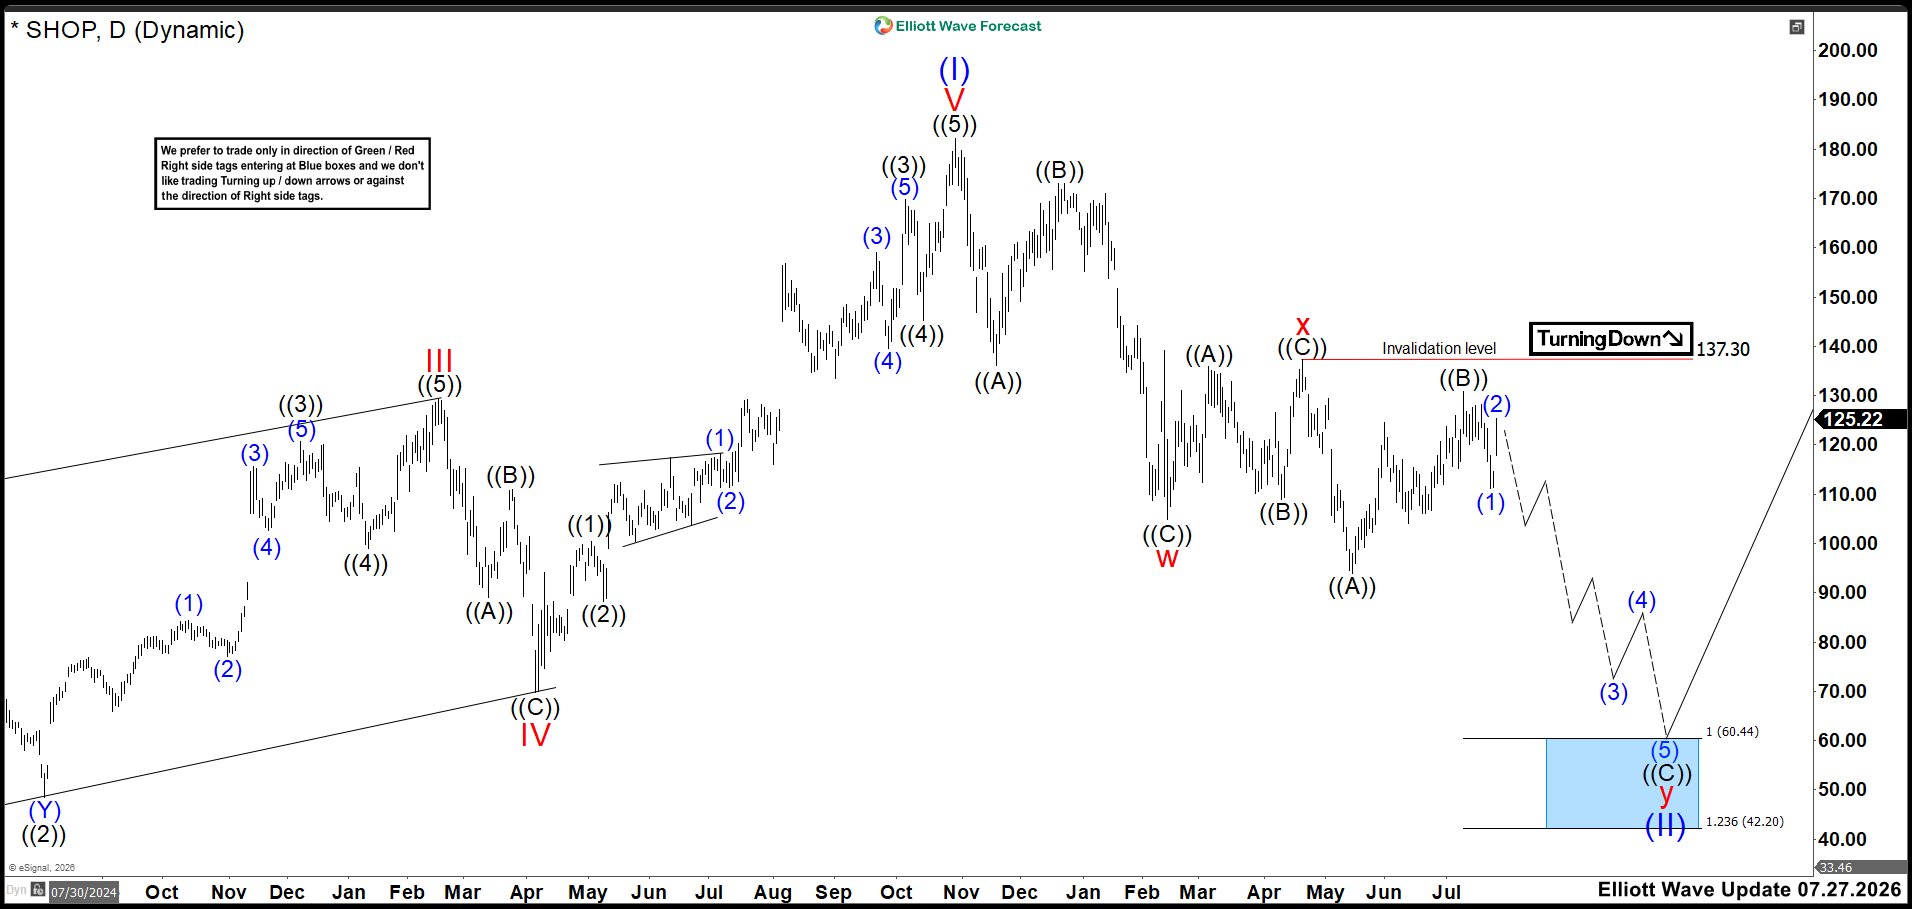
In this new update, we finally reach the moment of truth. The break of 104.92 was not what we expected, and the market bounced sharply. Now we track two clear scenarios, but both bearish. The first scenario requires price to stay below 137.30 and continue lower toward 60.44–42.20 to complete the double correction of wave (II). This path keeps the broader bearish structure intact and maintains pressure on the long‑term cycle.
However, if the market breaks above 137.30, the decline from wave (I) becomes a leading diagonal. That structure allows five waves lower forming wave “a.” The current rebound becomes wave “b,” which may reach 148.00–157.00. From that zone, we should expect strong bearish reaction to continue the correction of wave (II). Price behavior near those levels will define the next major cycle.
风险提示:本文所述仅代表作者个人观点,不代表 Followme 的官方立场。Followme 不对内容的准确性、完整性或可靠性作出任何保证,对于基于该内容所采取的任何行为,不承担任何责任,除非另有书面明确说明。
 暂无评论。 来发表第一条观点吧。