



19 August 2026 will be remembered as another explosive session for Gold traders.
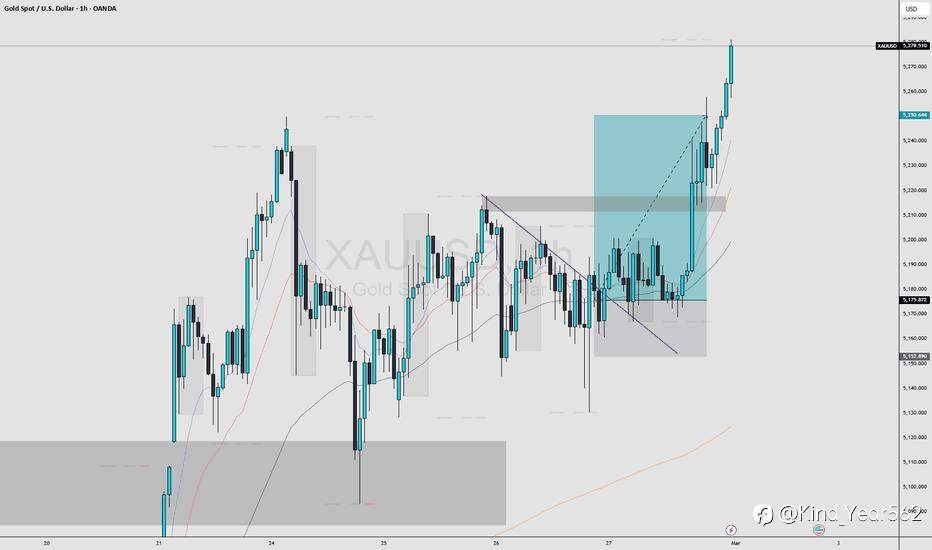
XAU/USD delivered a massive intraday move of approximately 1,570 pips on many trading feeds, with gold breaking sharply higher and pushing through the psychological $4,500/oz area.
But what actually triggered such a powerful move?
The Catalyst Behind Gold’s Surge
The biggest catalyst came from an unexpected move by the U.S. Treasury.
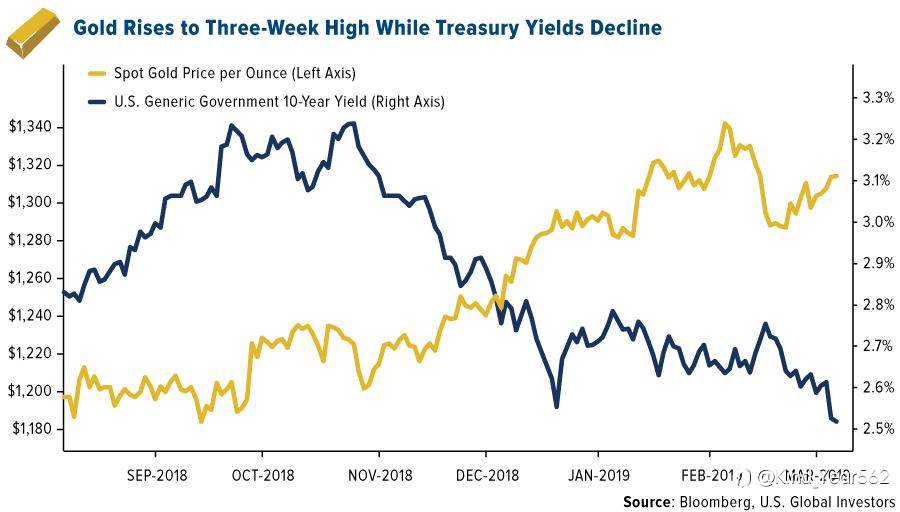
The Treasury announced that it would increase its buybacks of longer-dated U.S. government debt. The announcement immediately eased pressure in the bond market, sending long-term Treasury yields lower.
That was highly supportive for gold.
Gold is a non-yielding asset, so falling bond yields generally improve its relative attractiveness. At the same time, the U.S. Dollar Index weakened by around 0.8%, providing another tailwind for dollar-denominated gold. Reuters reported that spot gold climbed above $4,487/oz, briefly touching approximately $4,499/oz.
 #XAU/USD##forexmarket##Trader#
From Pullback to Powerful Breakout
The move was even more impressive because gold had started the session under pressure.
Earlier in the week, higher Treasury yields had pushed gold lower. On August 18, Reuters reported that gold declined as U.S. Treasury yields climbed to multi-decade highs.
Then the narrative suddenly changed.
Lower yields + weaker dollar + renewed safe-haven demand created the perfect environment for gold buyers.
The result was a powerful reversal followed by a breakout above important technical levels.
The $4,500 Level Becomes the Centre of Attention
Gold's move above $4,500 was particularly important from a technical perspective.
MarketWatch reported that gold moved above $4,500 for the first time in roughly two months, while the decline in long-term Treasury yields provided a major boost to the metal.
Reuters also noted that the rally pushed gold to its highest level in more than two and a half months.
This makes the $4,500 zone an important psychological and technical area for traders to monitor going forward.
What About the Fed?
The timing was also significant because traders were waiting for the Federal Reserve's July meeting minutes.
The minutes showed that some Fed officials remained concerned about persistent inflation and were open to higher rates if inflation failed to moderate.
However, softer economic data and the sharp decline in Treasury yields reduced immediate pressure on gold.
The CME FedWatch outlook cited by Reuters indicated that markets were still assigning a high probability to rates remaining unchanged at the September meeting.
Why the Move Was So Fast
The 1,570-pip move wasn't driven by a single factor.
It was the combination of:
- Lower U.S. Treasury yields
- A weaker U.S. dollar
- U.S. Treasury debt-buyback announcement
- Renewed safe-haven demand
- Breakout above major technical levels
- Strong momentum and short-covering
When several of these factors align simultaneously, gold can move extremely quickly.
What Traders Should Watch Next
After such an aggressive rally, traders should avoid chasing price blindly.
The key question now is whether gold can hold the $4,400–$4,500 region as support after the breakout.
Reuters reported on August 20 that gold subsequently pulled back after reaching a more-than-two-month high, with analysts highlighting the $4,400–$4,500 area as a potential new support zone.
A sustained hold above this zone could keep the bullish structure intact.
On the other hand, a failure to hold the breakout could trigger profit-taking and a deeper retracement.
The Bigger Picture
The 19 August move is another reminder of why gold remains one of the most volatile and closely watched instruments in global markets.
The metal is reacting not only to traditional safe-haven flows, but also to:
Fed expectations → Treasury yields → U.S. Dollar → liquidity conditions → gold.
For traders, the lesson from this move is simple:
Don't focus only on the gold chart.
When XAU/USD starts moving aggressively, watch the Dollar Index, Treasury yields, Fed expectations and major macro headlines at the same time.
The 1,570-pip explosion was not random volatility.
It was a powerful macro-driven repricing of gold.
已编辑 20 Aug 2026, 14:17
风险提示:本文所述仅代表作者个人观点,不代表 Followme 的官方立场。Followme 不对内容的准确性、完整性或可靠性作出任何保证,对于基于该内容所采取的任何行为,不承担任何责任,除非另有书面明确说明。
 暂无评论。 来发表第一条观点吧。