Market Context:
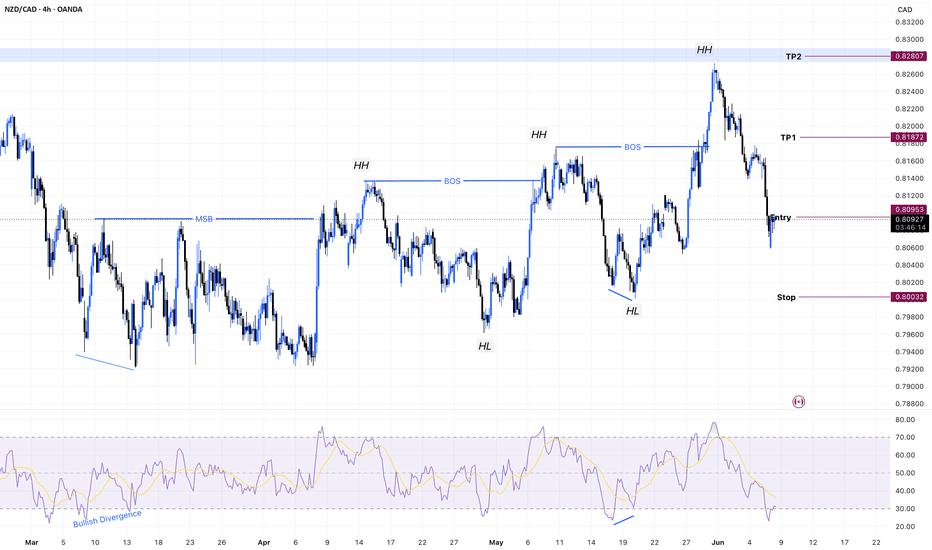
After bottoming out with a prominent Bullish RSI Divergence, NZDCAD executed a clean Market Structure Shift (MSS) by breaking its previous lower high. The buyers have firmly taken control, establishing a strong upward trend with three consecutive Higher Highs. The price is currently undergoing a healthy corrective retracement, offering a high-probability entry at a discounted structural level.
Technical Analysis:
Trend Transition: The clear shift from a bearish cycle to a series of consecutive Higher Highs confirms the validity of the new bullish regime.
Fibonacci Confluence: The price has pulled back precisely into the 0.618 Fibonacci Golden Zone. This area aligns structurally with the expectation of a new Higher Low formation before the next impulsive expansion.
Momentum Verification: The initial bullish divergence laid the foundation for this shift, and the current retracement allows the RSI to reset beautifully for the next leg up.
Trade Plan:
Entry Point: Long entry executed within the Fibonacci 0.618 retracement area.
Stop Loss (SL): Placed strictly below the Previous Higher Low to ensure proper trade invalidation if the bullish structure breaks.
Target (TP): Aiming for the Recent Swing High (Top High) to complete the next expansion phase.
Risk Management: Total trade exposure is strictly capped at 0.75% risk of account equity, adhering to a disciplined 1:1 minimum structural return.
Disclaimer: This analysis is for educational purposes only. Always monitor structural validation and candle close confirmation at key Fibonacci levels before trade execution.
风险提示:本文所述仅代表作者个人观点,不代表 Followme 的官方立场。Followme 不对内容的准确性、完整性或可靠性作出任何保证,对于基于该内容所采取的任何行为,不承担任何责任,除非另有书面明确说明。

暂无评论,立马抢沙发