


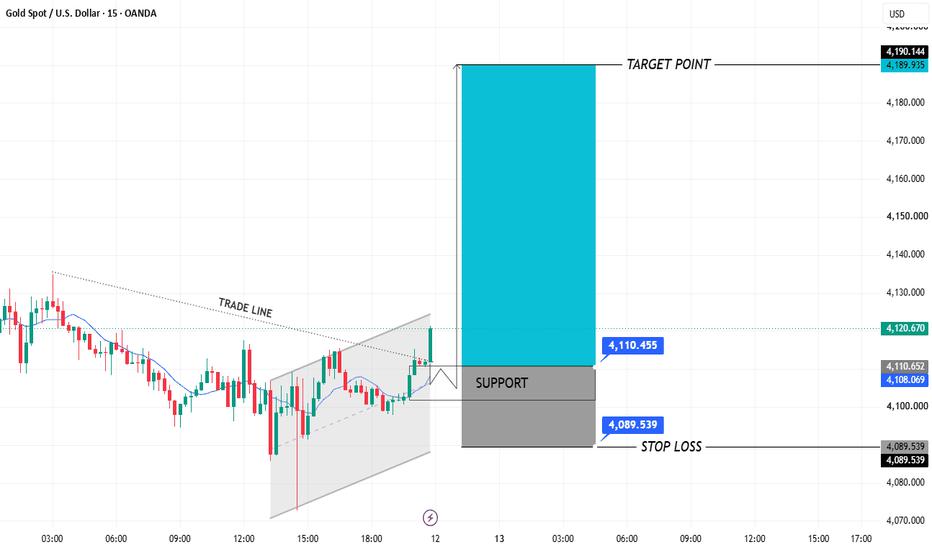
AU/USD 15M Analysis
Bullish Bias
Ascending Triangle Breakout
Market Structure
Trend: Short-term bullish.
Pattern: Price has been consolidating inside an ascending triangle / rising channel.
Breakout: A strong bullish candle has broken above the descending trade line, signaling buyers are gaining control.
Momentum: Consecutive higher lows suggest accumulation before the breakout.
Key Levels
Entry / Support Zone
4108.07 - 4110.45
4108.074110.45
This area acts as immediate support after the breakout.
Resistance / Target
4189.90 - 4190.14
4189.904190.14
This is the projected upside target shown on the chart.
Stop Loss
4089.54
4089.54
A break below this level would invalidate the bullish setup.
Trade Idea (Educational)
Bullish Scenario
Buy on a retest of 4108-4110
Stop Loss: 4089.54Target: 4189-4190
Alternative Scenario
If price closes back below 4108
The breakout may fail.Expect a move toward 4100 and possibly the 4090 support region.
Liquidity & Price Action
Liquidity above recent highs: The market may attempt to sweep the highs before continuing higher.
Retest behavior: A healthy breakout often revisits the broken trendline/support zone before expanding upward.
Risk-to-reward: The setup offers a favorable RR if entries are taken near support rather than after a large impulsive candle.
Bias Summary
Bias
BULLISH
Timeframe
15 Minutes
Support4108-4110
Invalidation4089.54
Target4189-4190
Overall Bias: BULLISH while price holds above the 4108 support zone, with 4190 as the main upside target.
This analysis is for educational purposes and not financial advice.
风险提示:本文所述仅代表作者个人观点,不代表 Followme 的官方立场。Followme 不对内容的准确性、完整性或可靠性作出任何保证,对于基于该内容所采取的任何行为,不承担任何责任,除非另有书面明确说明。
 暂无评论。 来发表第一条观点吧。