


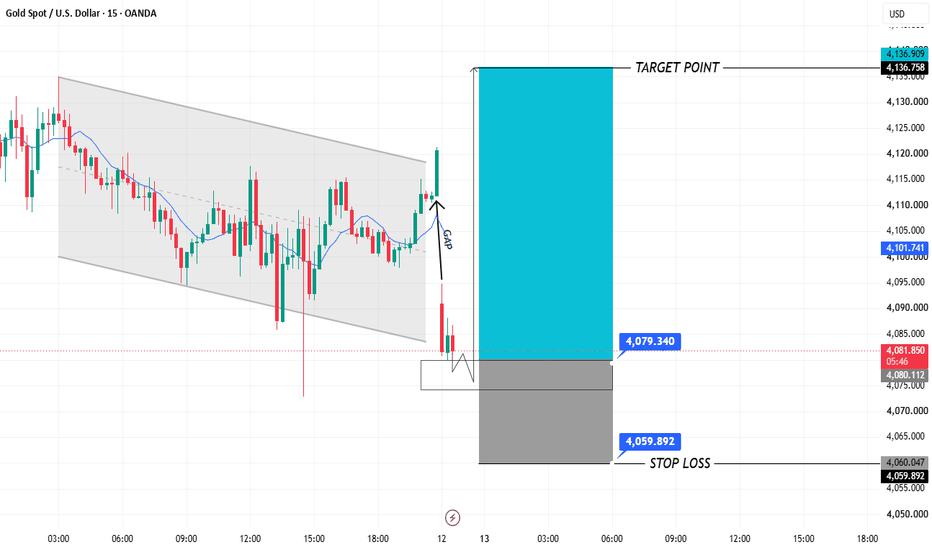
📊 Market Structure
Timeframe: 15 Minutes
Current Price: around 4083.8
Pattern: Descending channel followed by a bullish breakout
Key Event: Price pushed above the channel, created a gap/imbalance (FVG), and then retraced sharply into a support zone.
Bias: Bullish continuation while support holds.
🔍 What the Chart Shows
Price traded inside a falling channel for several hours.
A strong bullish candle broke above the upper trendline, signaling a potential trend reversal.
After the breakout, sellers stepped in aggressively, causing a fast pullback.
The pullback is currently testing the demand / support area around 4076–4080, which is also near the marked entry zone.
📈 Bullish Trade Idea
Entry Zone:4079.3 – 4080.1
Stop Loss:4059.9
Take Profit (Main):4136.8
Risk: ~19 points
Reward: ~57 points
Risk : Reward: approximately 1 : 3
🎯 Potential Targets
Target
Level
TP1
4102
TP2
4115
TP3
4125
TP4 (Final)
4136.8
⚠️ Important Resistance
4100–4102: Psychological and short-term resistance.
4115–4120: Previous swing highs.
4135–4137: Major target zone shown on the chart.
🛡️ Invalidation
A 15-minute candle closing below 4076 would weaken the bullish setup.
A break below 4059.9 invalidates the trade idea and could open the door for further downside.
📌 TradingView Style Summary
XAU/USD Bullish Breakout Retest | Buy the Support for 4136 Target
Bias: Bullish
Entry: 4079.34
SL: 4059.89
TP1: 4102
TP2: 4115
TP3: 4125
TP4: 4136.76
Setup: Channel breakout → pullback into demand → continuation higher.
风险提示:本文所述仅代表作者个人观点,不代表 Followme 的官方立场。Followme 不对内容的准确性、完整性或可靠性作出任何保证,对于基于该内容所采取的任何行为,不承担任何责任,除非另有书面明确说明。
 暂无评论。 来发表第一条观点吧。