


SMC Trading point update
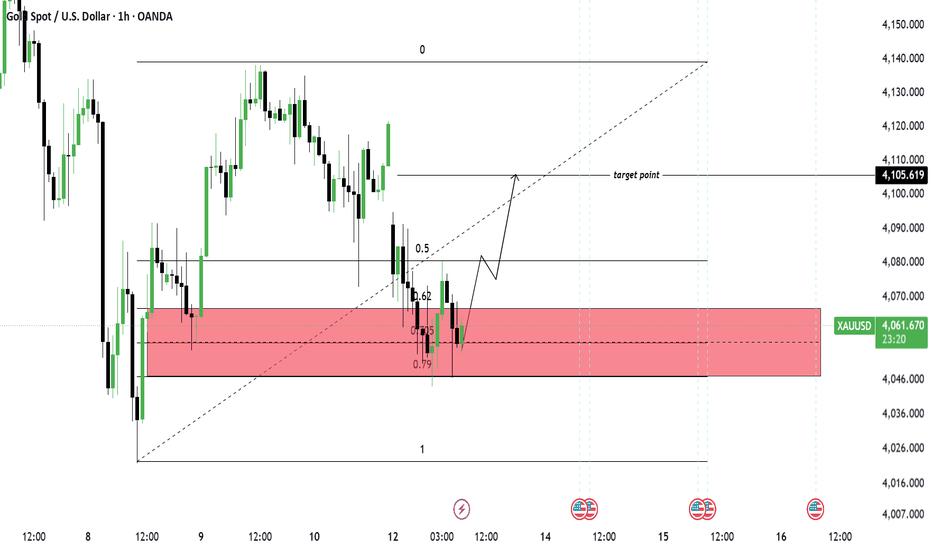
Chart Overview
• Pair: Gold Spot / USD - 1 Hour timeframe
• Current price: $4,062.43
• Date: Jul 13, 2026 07:25 UTC-5
• Bias on chart: Bullish pullback → continuation up
Key Levels Marked
1. Major Demand Zone - RED BOX: $4,046 - $4,066
Price just wicked into the 0.705 - 0.79 fib area inside this zone and bounced. This is strong confluence: fib + horizontal demand + diagonal trendline support.
2. Fib Retracement: Drawn from swing low to swing high
• 0.5: $4,080
• 0.62: $4,070
• 0.705 - 0.79: Inside the red demand box
• 0: $4,140
3. Target Point: $4,105.61
This lines up just under the previous 1H supply and the diagonal resistance.
Me SMC trading point
4. Diagonal Trendline: Rising support from the swing low. Price tapped it and reacted up.
The Idea on the Chart
The arrow shows the expected move:
1. Buy from demand: Reaction off $4,046 - $4,066 zone + trendline
2. First Target: $4,080 - 0.5 fib
3. Main Target: $4,105 - Previous 1H supply / "target point"
This is a classic SMC "buy in discount" setup. Price came to demand, took liquidity below, and is now pushing up.
dipcrschn Signal Format
• Bias: Bullish above $4,046
• Buy Zone: $4,050 - $4,065
• SL: Below $4,040 - under the zone + structure
• TP1: $4,080
• TP2: $4,105
• Invalidation: 1H close below $4,046 flips bias bearish
Please boost this analysis
风险提示:本文所述仅代表作者个人观点,不代表 Followme 的官方立场。Followme 不对内容的准确性、完整性或可靠性作出任何保证,对于基于该内容所采取的任何行为,不承担任何责任,除非另有书面明确说明。
 暂无评论。 来发表第一条观点吧。