


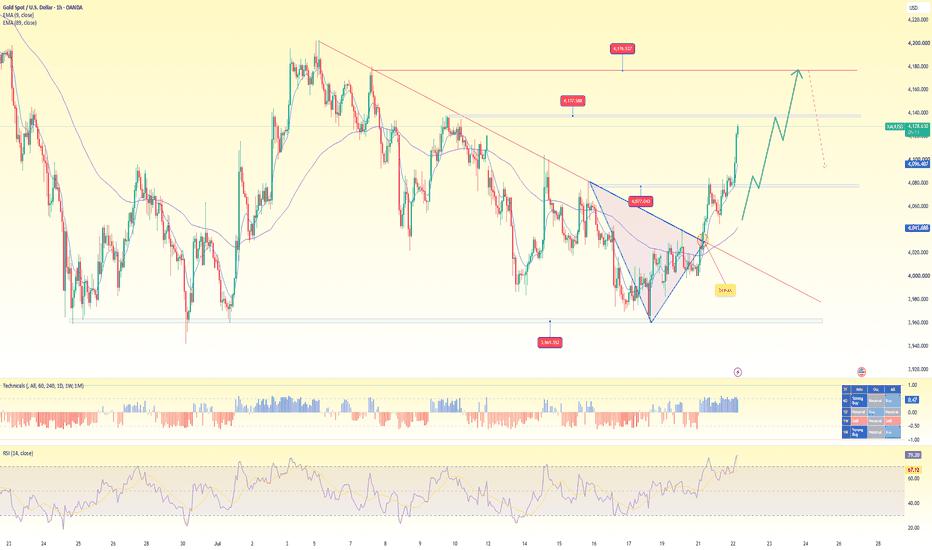
1. Trend Overview
Short-term trend: Strongly Bullish
Key signals:
Price has broken above the descending trendline that had been in place since the beginning of the month.
It has also broken out of a descending triangle / falling wedge pattern (the circled area on the chart).
EMA 9 = 4,096 is positioned above EMA 89 = 4,041, confirming bullish momentum.
RSI (14) = 79, indicating that the market is very strong but has also entered the overbought zone.
👉 Conclusion: Buyers are currently in control of the H1 trend. However, after such a steep rally, the probability of a technical pullback is relatively high before the uptrend continues.
2. Current Outlook
Gold is currently in a strong bullish phase following the breakout of a bearish structure. The higher-probability scenario is a short-term pullback toward 4,080, followed by a continuation move toward 4,176.
The current bullish structure would only be invalidated if an H1 candle closes below 4,020.
3. Resistance Levels
Immediate resistance: 4,137 – 4,140
Major resistance: 4,176 – 4,180
4. Support Levels
Immediate support: 4,077 – 4,080
Dynamic support: EMA 89 around 4,041 – 4,045
Strong demand zone: 4,020 – 4,030
--------------
SELL GOLD zone : 4176 - 4179
SL : 4184
TP : 4160 - 4132 - 4105
----------------
风险提示:本文所述仅代表作者个人观点,不代表 Followme 的官方立场。Followme 不对内容的准确性、完整性或可靠性作出任何保证,对于基于该内容所采取的任何行为,不承担任何责任,除非另有书面明确说明。
 暂无评论。 来发表第一条观点吧。